noun (plural inequalities) [mass noun] difference in size, degree, circumstances, etc.; lack of equality: social inequality | [count noun] : the widening inequalities in income.
1 archaic lack of smoothness or regularity in a surface: the inequality of the ground hindered their footing.
2 Mathematics the relation between two expressions that are not equal, employing a sign such as ≠ ‘not equal to’, > ‘greater than’, or < ‘less than’.
3 [count noun] Mathematics a symbolic expression of the fact that two quantities are not equal.
Inequality and the Biosphere
Maike Hamann, Kevin Berry, Tomas Chaigneau, Tracie Curry, Robert Heilmayr, Patrik J.G. Henriksson, Jonas Hentati-Sundberg, Amir Jina, Emilie Lindkvist, Yolanda Lopez-Maldonado, Emmi Nieminen, Matías Piaggio, Jiangxiao Qiu, Juan C. Rocha, Caroline Schill, Alon Shepon, Andrew R. Tilman, Inge van den Bijgaart, and Tong Wu
What is inequality and why studying it?
“unequal distribution of privileges between people, resulting from prevailing institutions, norms, and beliefs” Jean-Jacques Rousseau (1754)
One of the pressing challenges of XXI century (SDG10)
7 dimensions: economic, political, environmental, social, cultural, spatial, and knowledge-based
Typically focus on economic aspects and one way interactions
Inequity can be normative: unfair or unjust distribution of priviledges
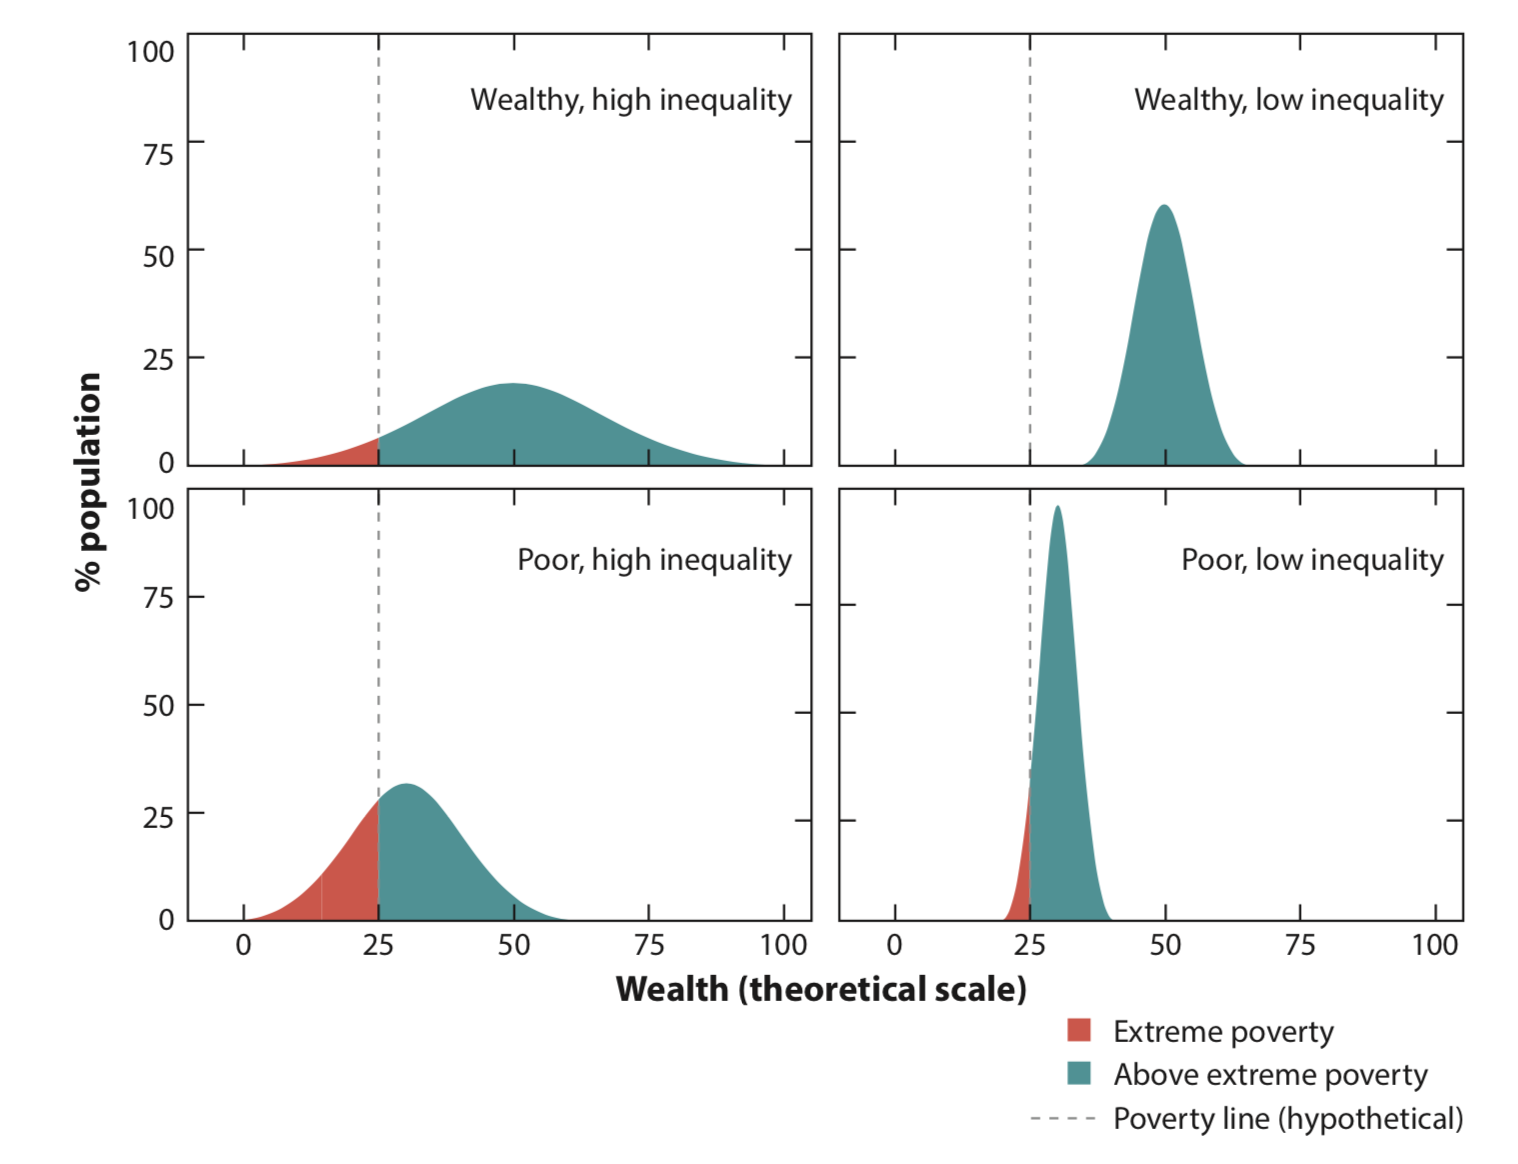
Description of the variance of the distribution of a resource
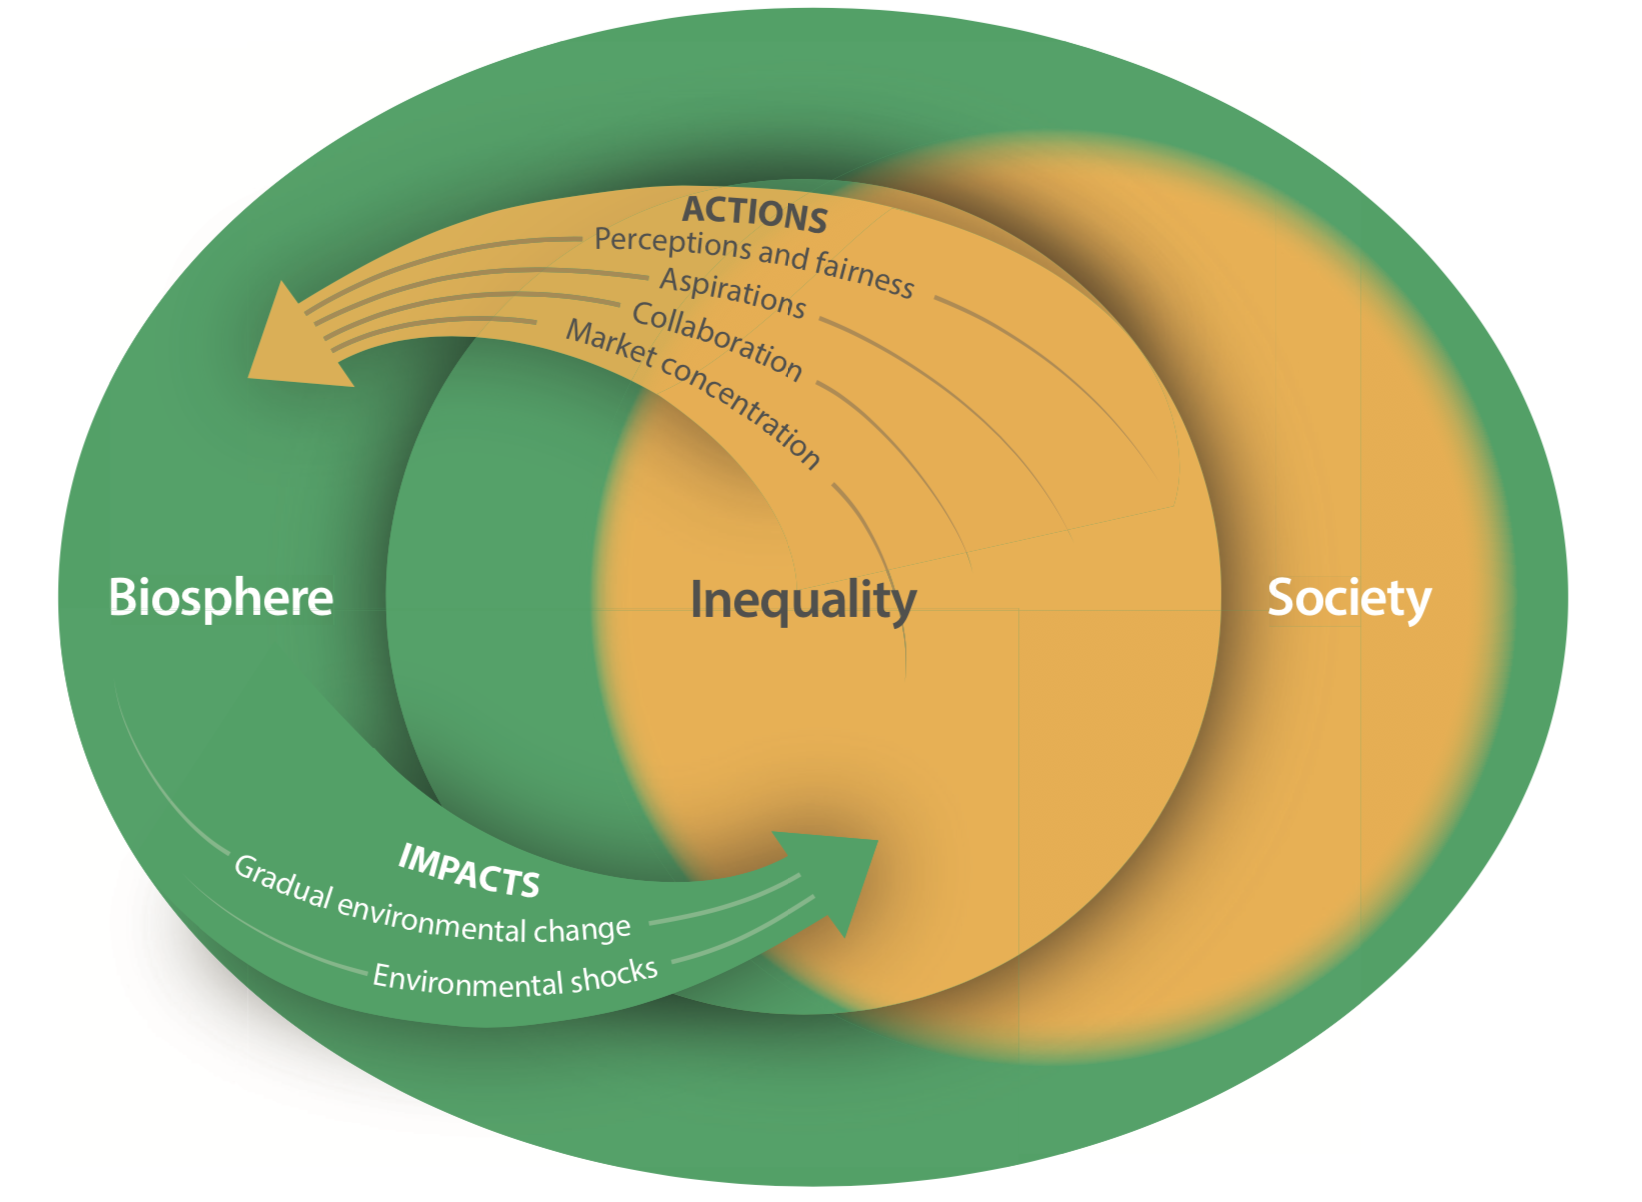
Changes in the biosphere can reinforce existing inequalities
Achieving the Sustainable Development Goals in an Unequal World
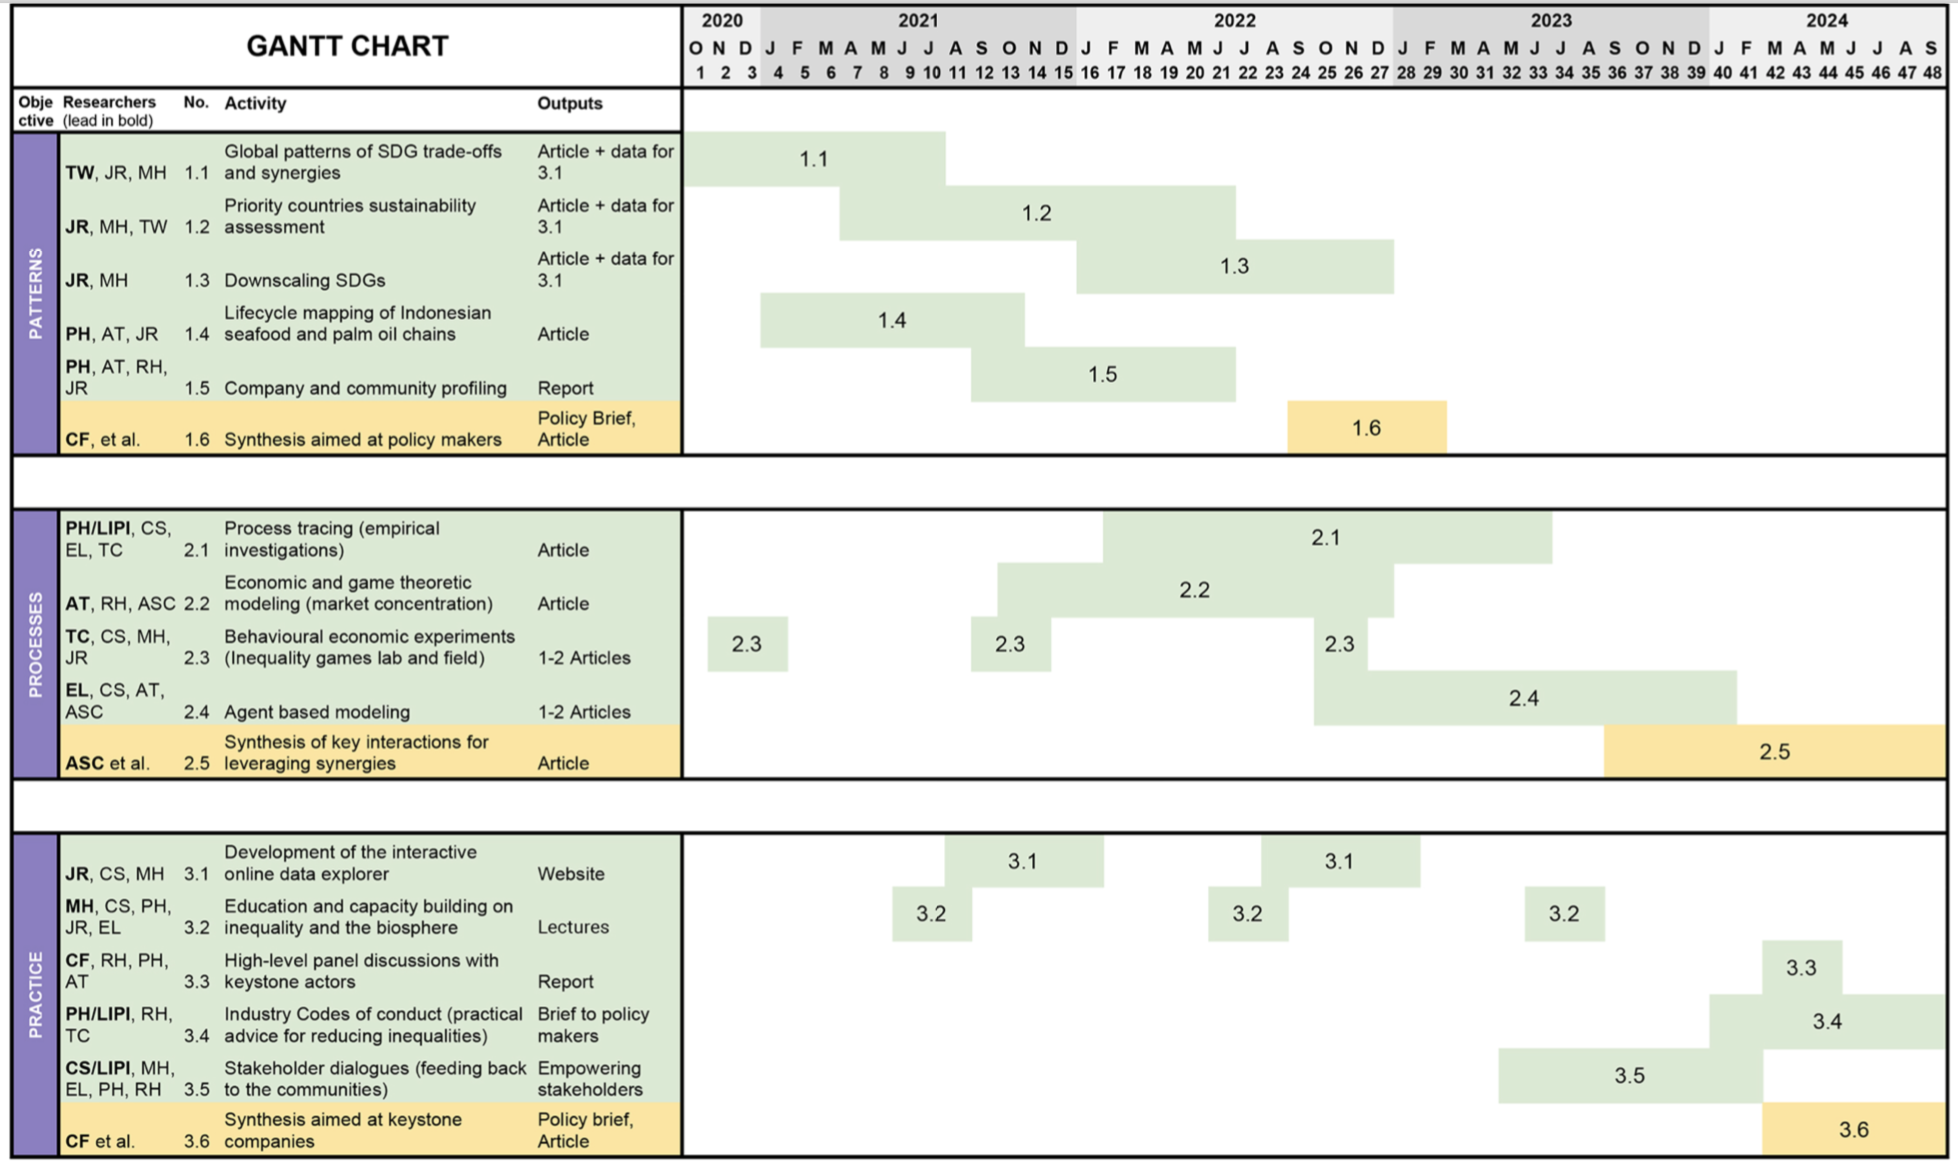
~20M SEK / 4yr FORMAS grant 2020-2024
Objectives
Identify synergies and trade-offs between reducing inequalities (SDG 10) and safeguarding the biosphere (SDGs 14 & 15)
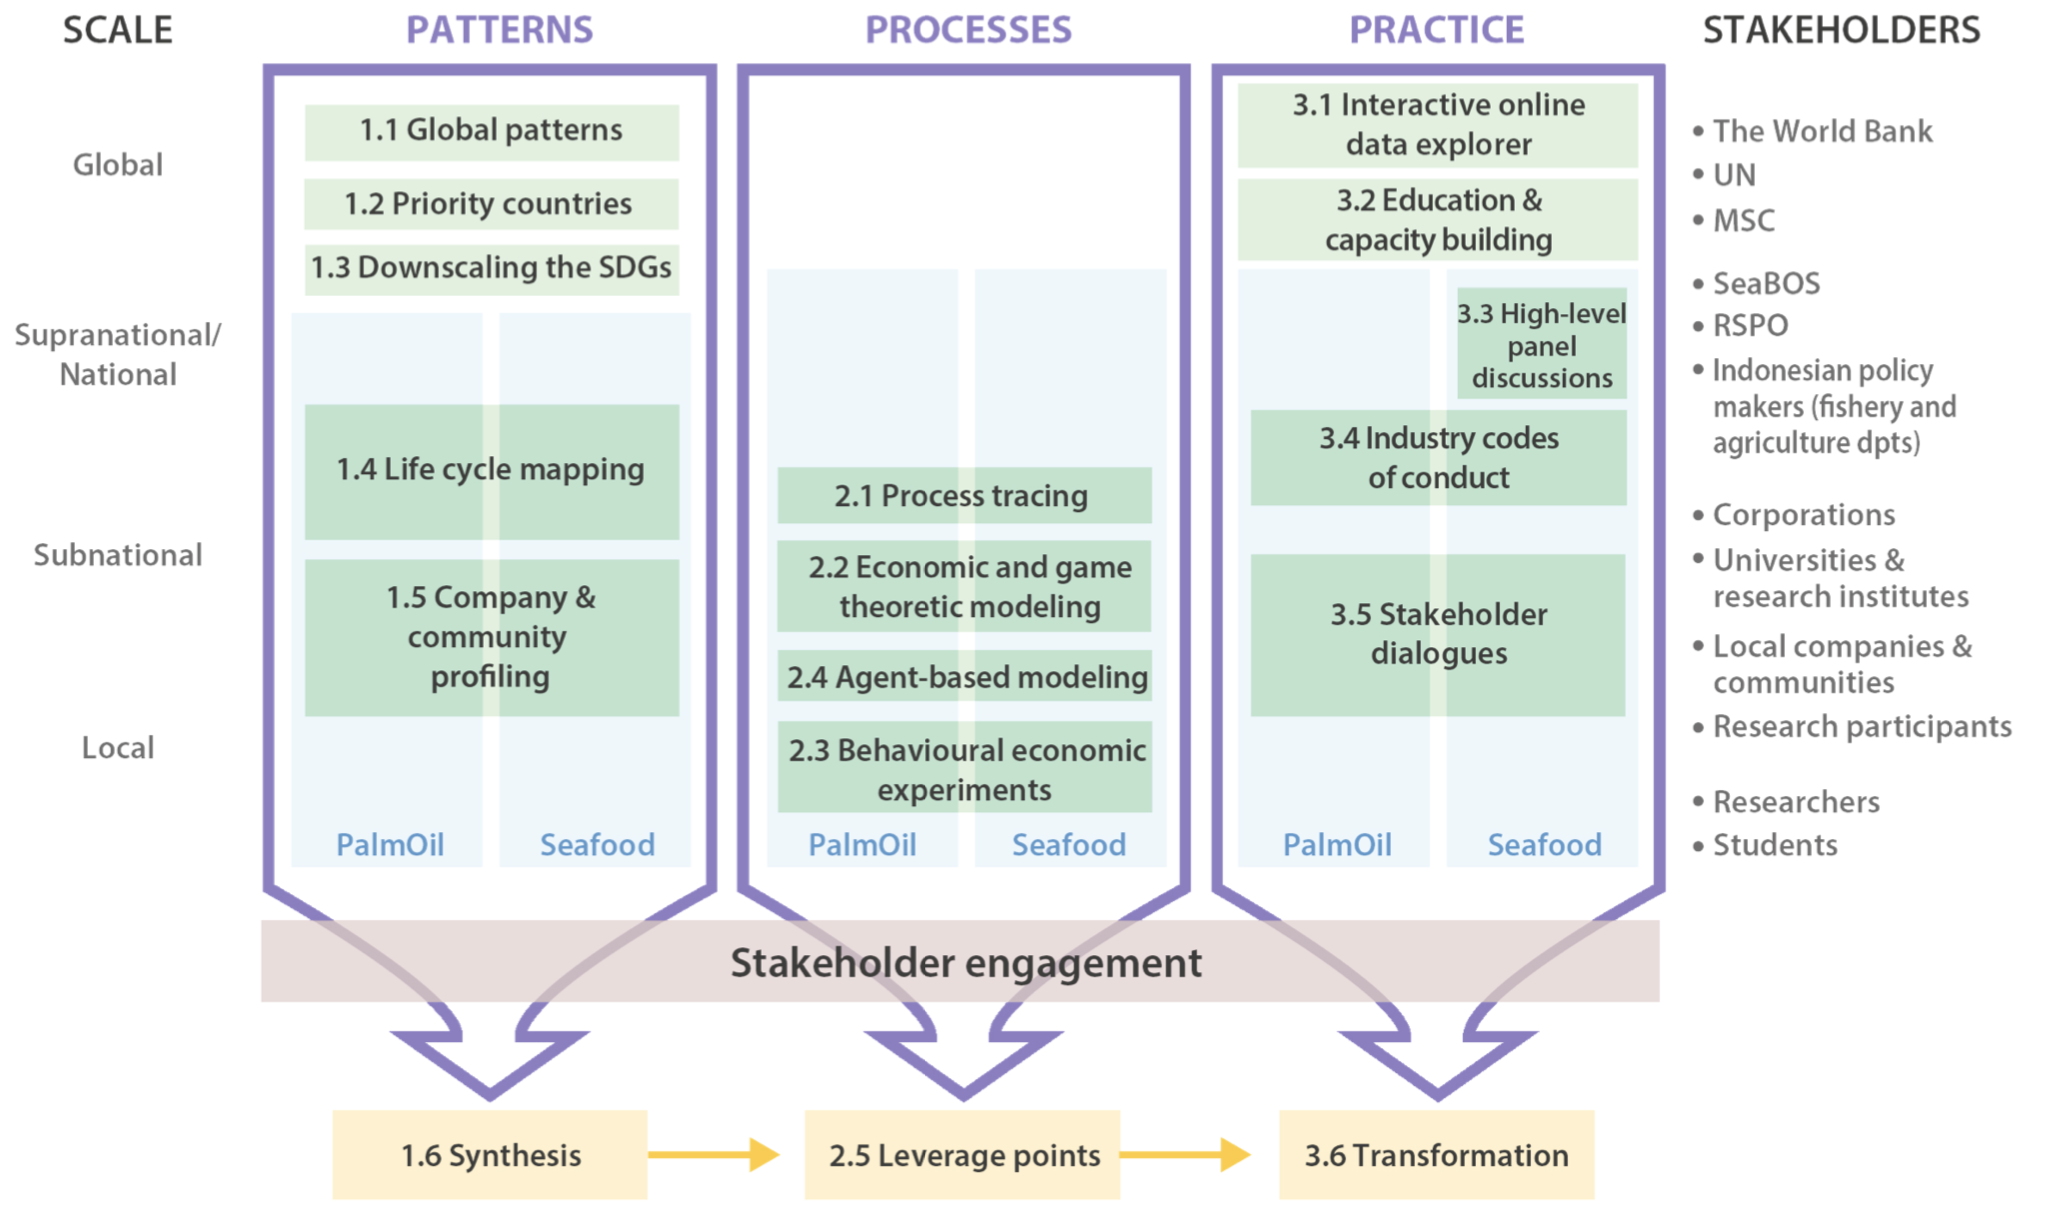
Patterns: To identify and map occurrences of synergies and trade-offs between reducing inequalities and safeguarding the biosphere at different scales.
Processes: To investigate how and why inequalities influence the interactions between actors (from individuals to corporations) and the biosphere, using case studies of the seafood and palm oil industries in Indonesia.
Practice: To educate, engage and empower a variety of actors to identify and implement practical interventions that enhance synergies and minimize trade-offs to achieve sustainable development.
Trilemma
“Rubik’s Cube” by wwarby is licensed under CC BY-NC-ND 2.0
Trilemma
Can countries achieve prosperity, environmental and inequality goals simultanously?
“Rubik’s Cube” by Caramdir is licensed under CC BY 2.0
Data
Ecological footprint: A metric in hectares per person needed to supply an average citizen needs in terms of resources, water, energy, and land. It takes into account trading between countries.
Inequality: Gini is a common metric of inequality calcualted per country. Higher values means more unequal societies, and it is available at country level for at least 2 decades.
Prosperity: The World Bank reports several prosperity indicators per country per year. The Gross National Income per capita (GNI) has wide geographical coverage and in time.
Relatively complete data for 53 countries over 2 decades
The trilemma exist: countries struggle to achieve the three goals simultaneously.
Countries can be grouped into 2-3 typologies of trajectories within the trilemma space.
Can countries achieve prosperity, environmental and inequality goals simultanously?
Inequality and ecological footprint metrics pull countries in opposite directions
Higher prosperity often leads to higher ecological footprints
Group 1 countries are trapped in a region of high inequality and random moves within the space
Group 2 countries had large movements within the space but not a definite direction
Group 3 countries move little but with relatively defined directions towards the prosperity, low inequality but high environmental footprint corner.