Abstract
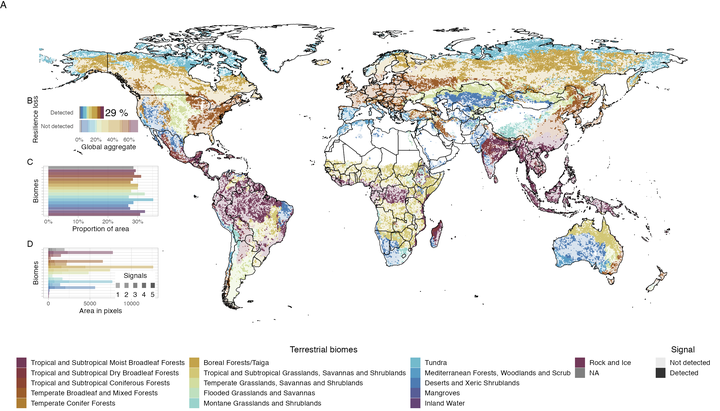
Ecosystems around the world are at risk of critical transitions due to increasing anthropogenic pressures and climate change. Yet it is unclear where the risks are higher or where in the world ecosystems are more vulnerable. Here I measure resilience of primary productivity proxies for marine and terrestrial ecosystems globally. Up to 29% of global terrestrial ecosystem, and 24% marine ones, show symptoms of resilience loss. These symptoms are shown in all biomes, but Arctic tundra and boreal forest are the most affected, as well as the Indian Ocean and Eastern Pacific. Although the results are likely an underestimation, they enable the identification of risk areas as well as the potential synchrony of some transitions, helping prioritize areas for management interventions and conservation.
When ecosystems are closed to tipping points or potential critical transitions, they leave statistical signatures on time series know as critical slowing down. It means that they take more time to recover after disturbances, leading to an increase in variance and autocorrelation. In this paper I applied known early warning signals of critical transitions, and complement them with critical speeding up and fractal dimensions to remote sensing data of primary productivity of ecosystems in land and oceans.
Seeing from space, primary productivity is the pulse of life in the biosphere and is typically measured as carbon stored in plants and phytoplankton. The dataset is imperfect and perhaps too short to capture long term dynamics, but to date it is the best observational record we have.
About a third of the terrestrial ecosystems, and about a quarter of the oceans are showing symptoms of resilience loss.
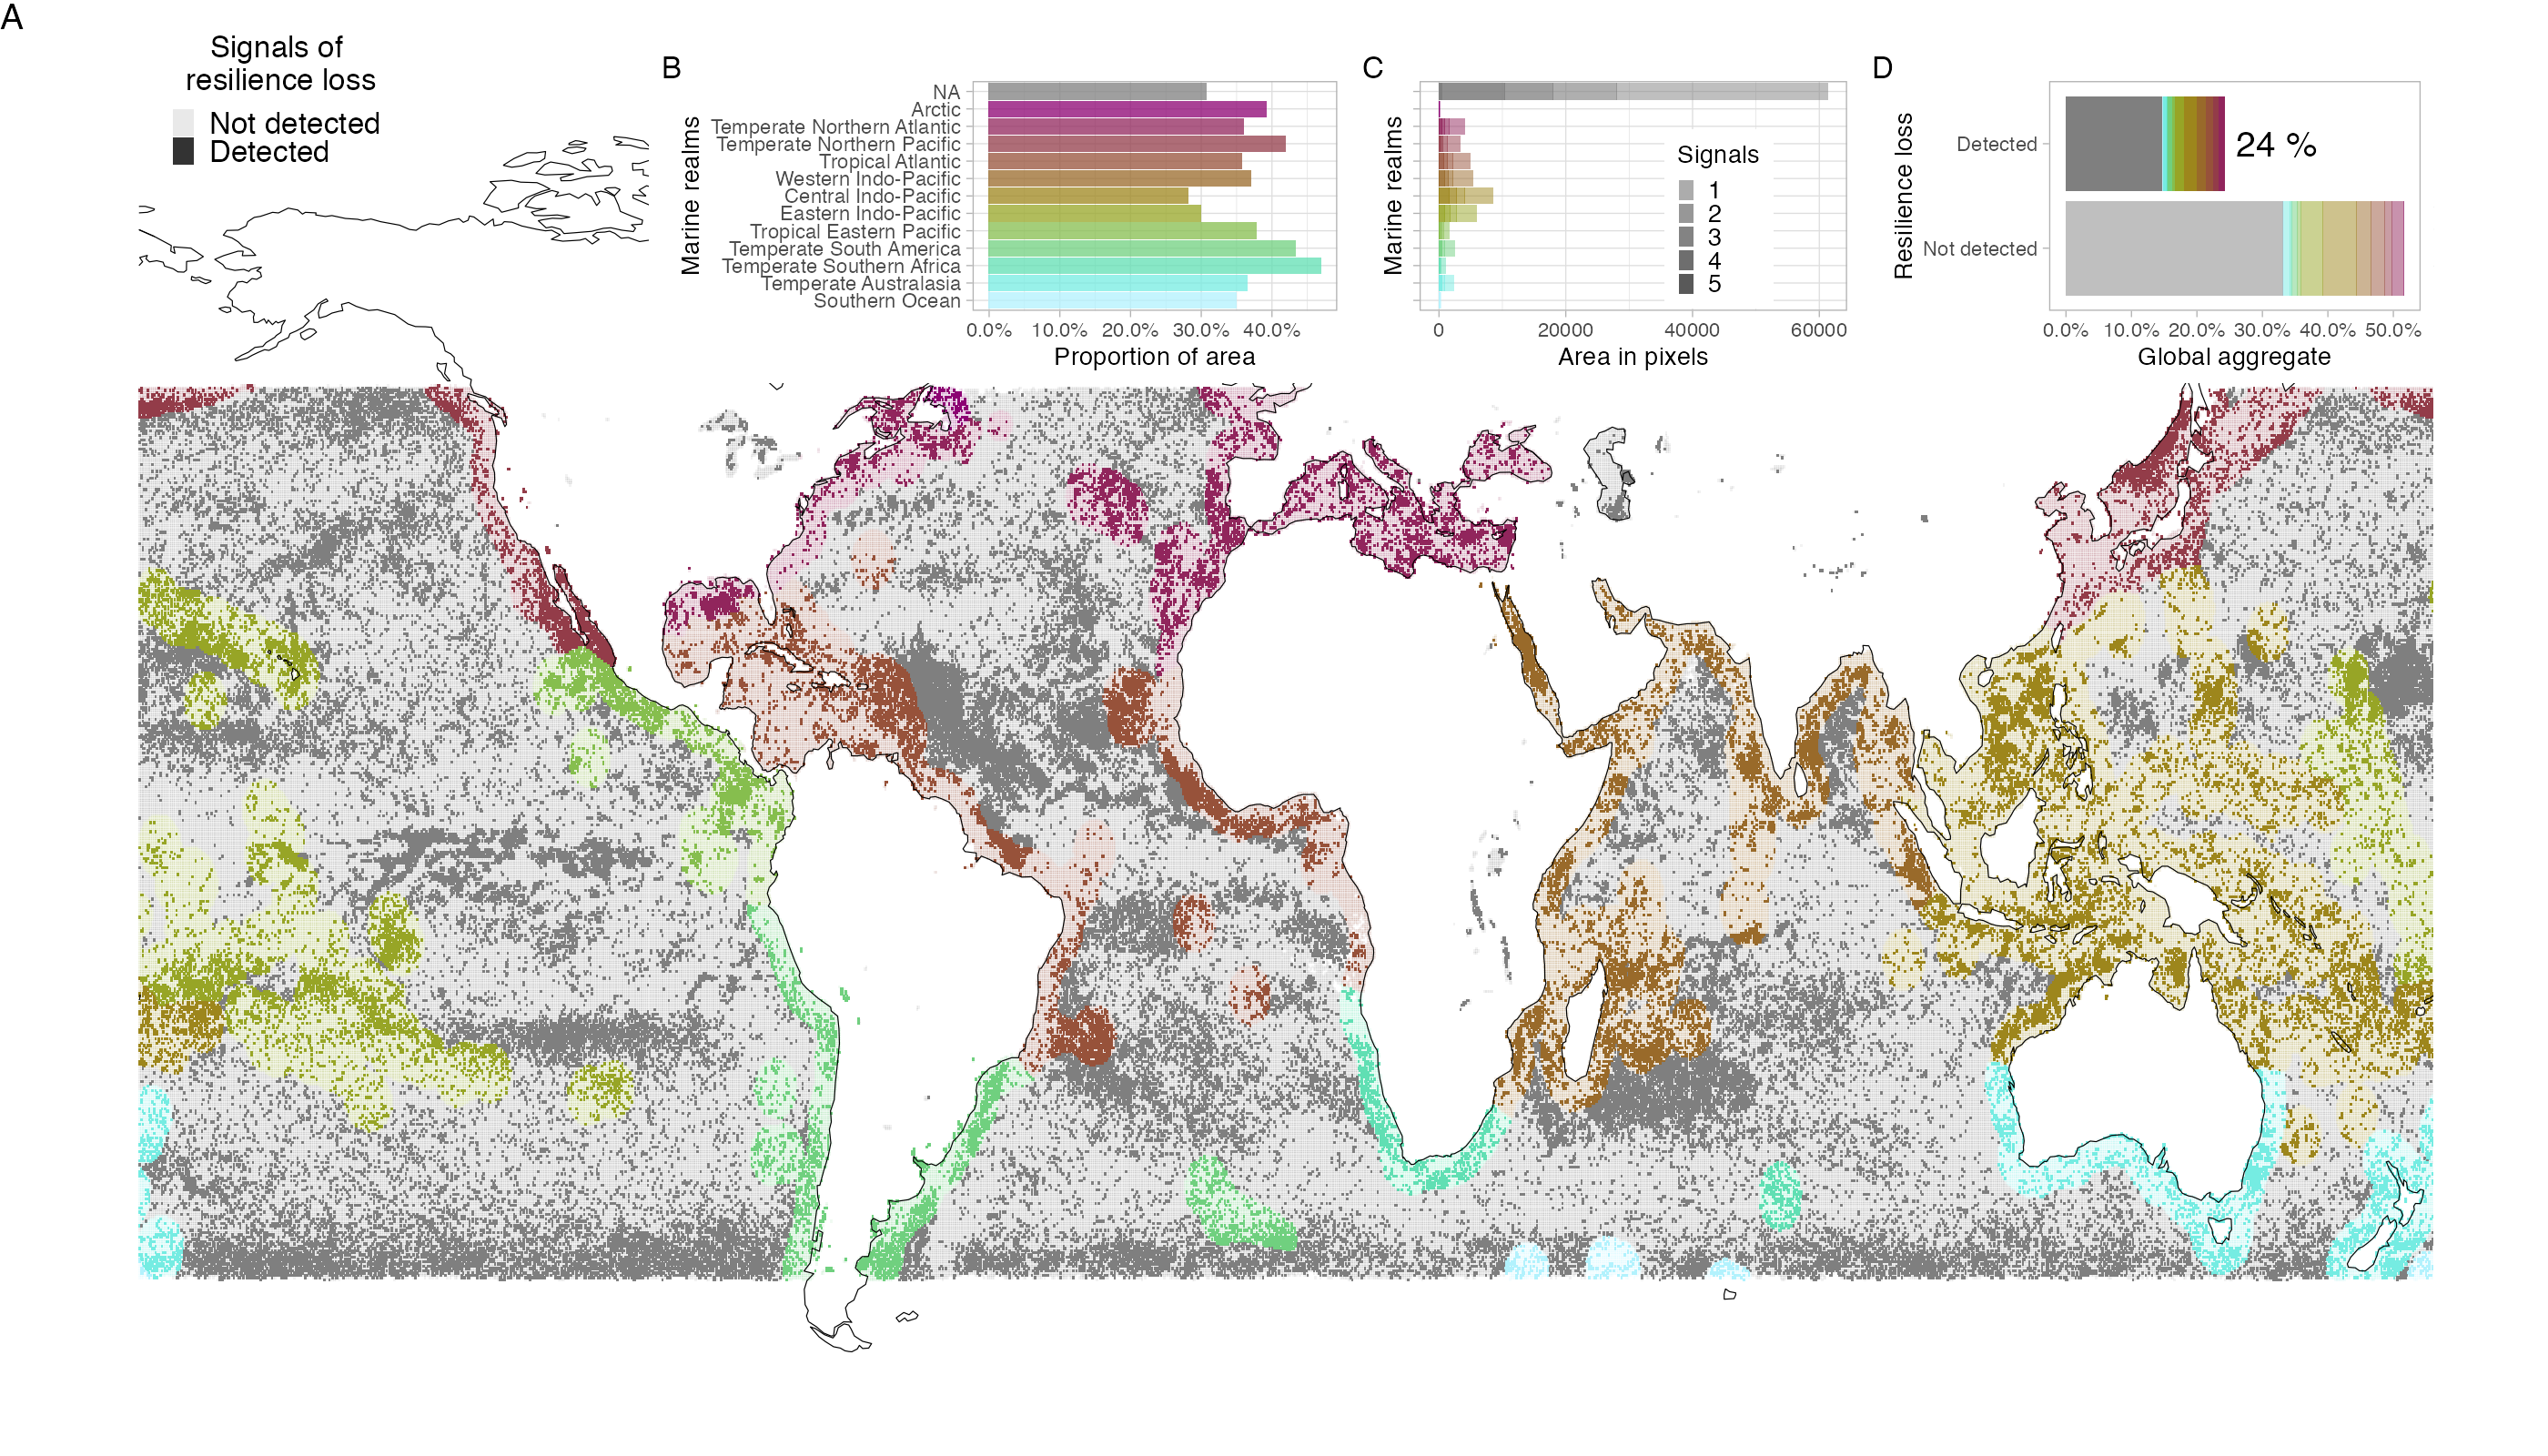
The two maps above shows in darker colours the areas where resilience loss is detected. I hope these results helps business, cities, and nations identify priority areas for management. The spatial resolution might help design land and sea use plans that take ecological vulnerability into account, for example by reducing pressures or encouraging uses that diversify the set of ecosystem services expected from ecosystems. Multifunctional landscapes can have productivity (e.g agriculture) while safeguarding some levels of ecological integrity through corridors or areas used for recreation. Companies could use these maps to re-evaluate where do they get they primary resources from and decide on relocation or alternatives for outsourcing. No matter the scale, we all have a role to play in caring for ecosystems resilience and maintaining their ability to provide the ecosystem services we all depend on.
It is a fairly technical paper, but I did my best to make the read as clear and enjoyable as possible. I hope you enjoy it despite the technicalities. And please reach out if you have any questions or want to learn more about it.