Ecosystems are showing symptoms of resilience loss
Analysis: one pixel
![]()
The generic resilience indicators do not necessarily align with critical slowing down or speeding up theories
Detection
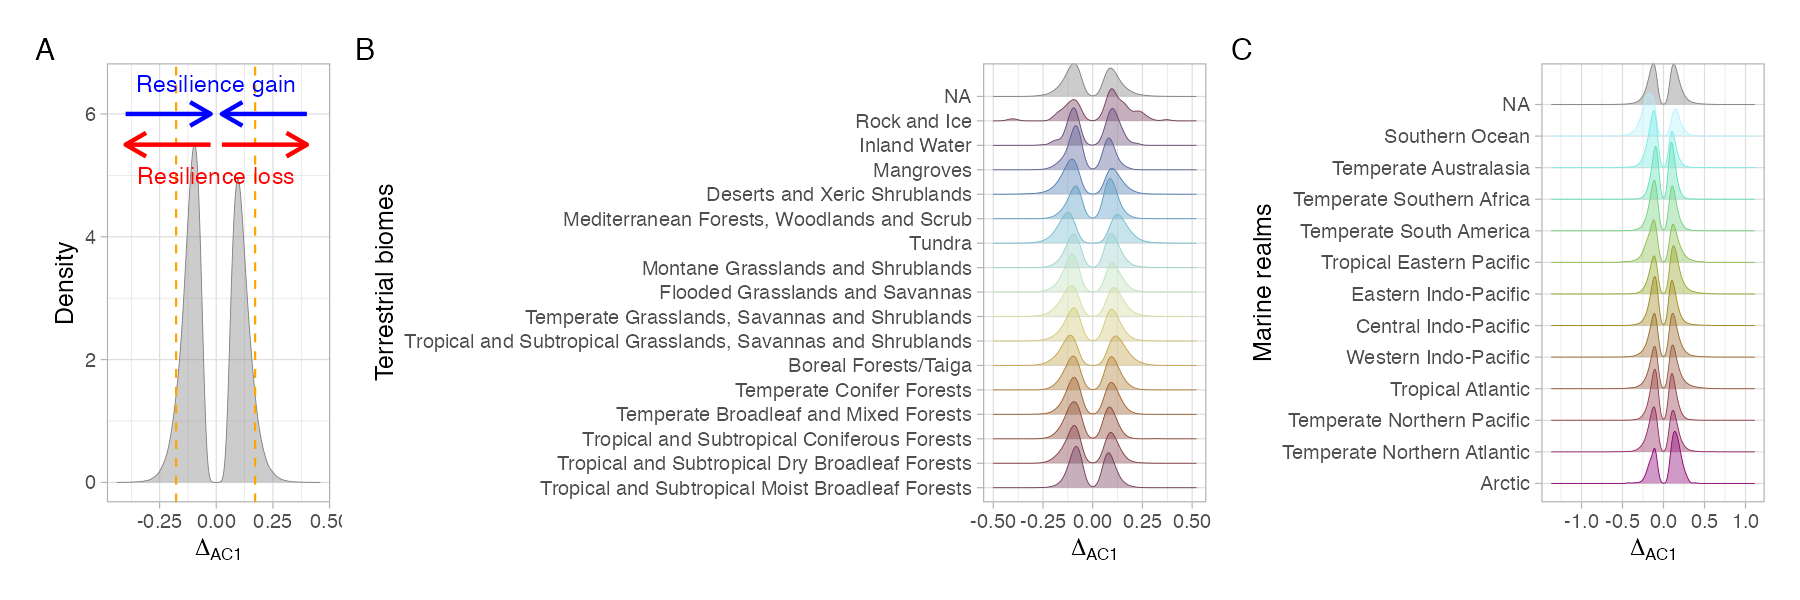
In the absence of ground truth, if \(\Delta\) is > 95% or < 5% of the distribution is considered a signal of resilience loss
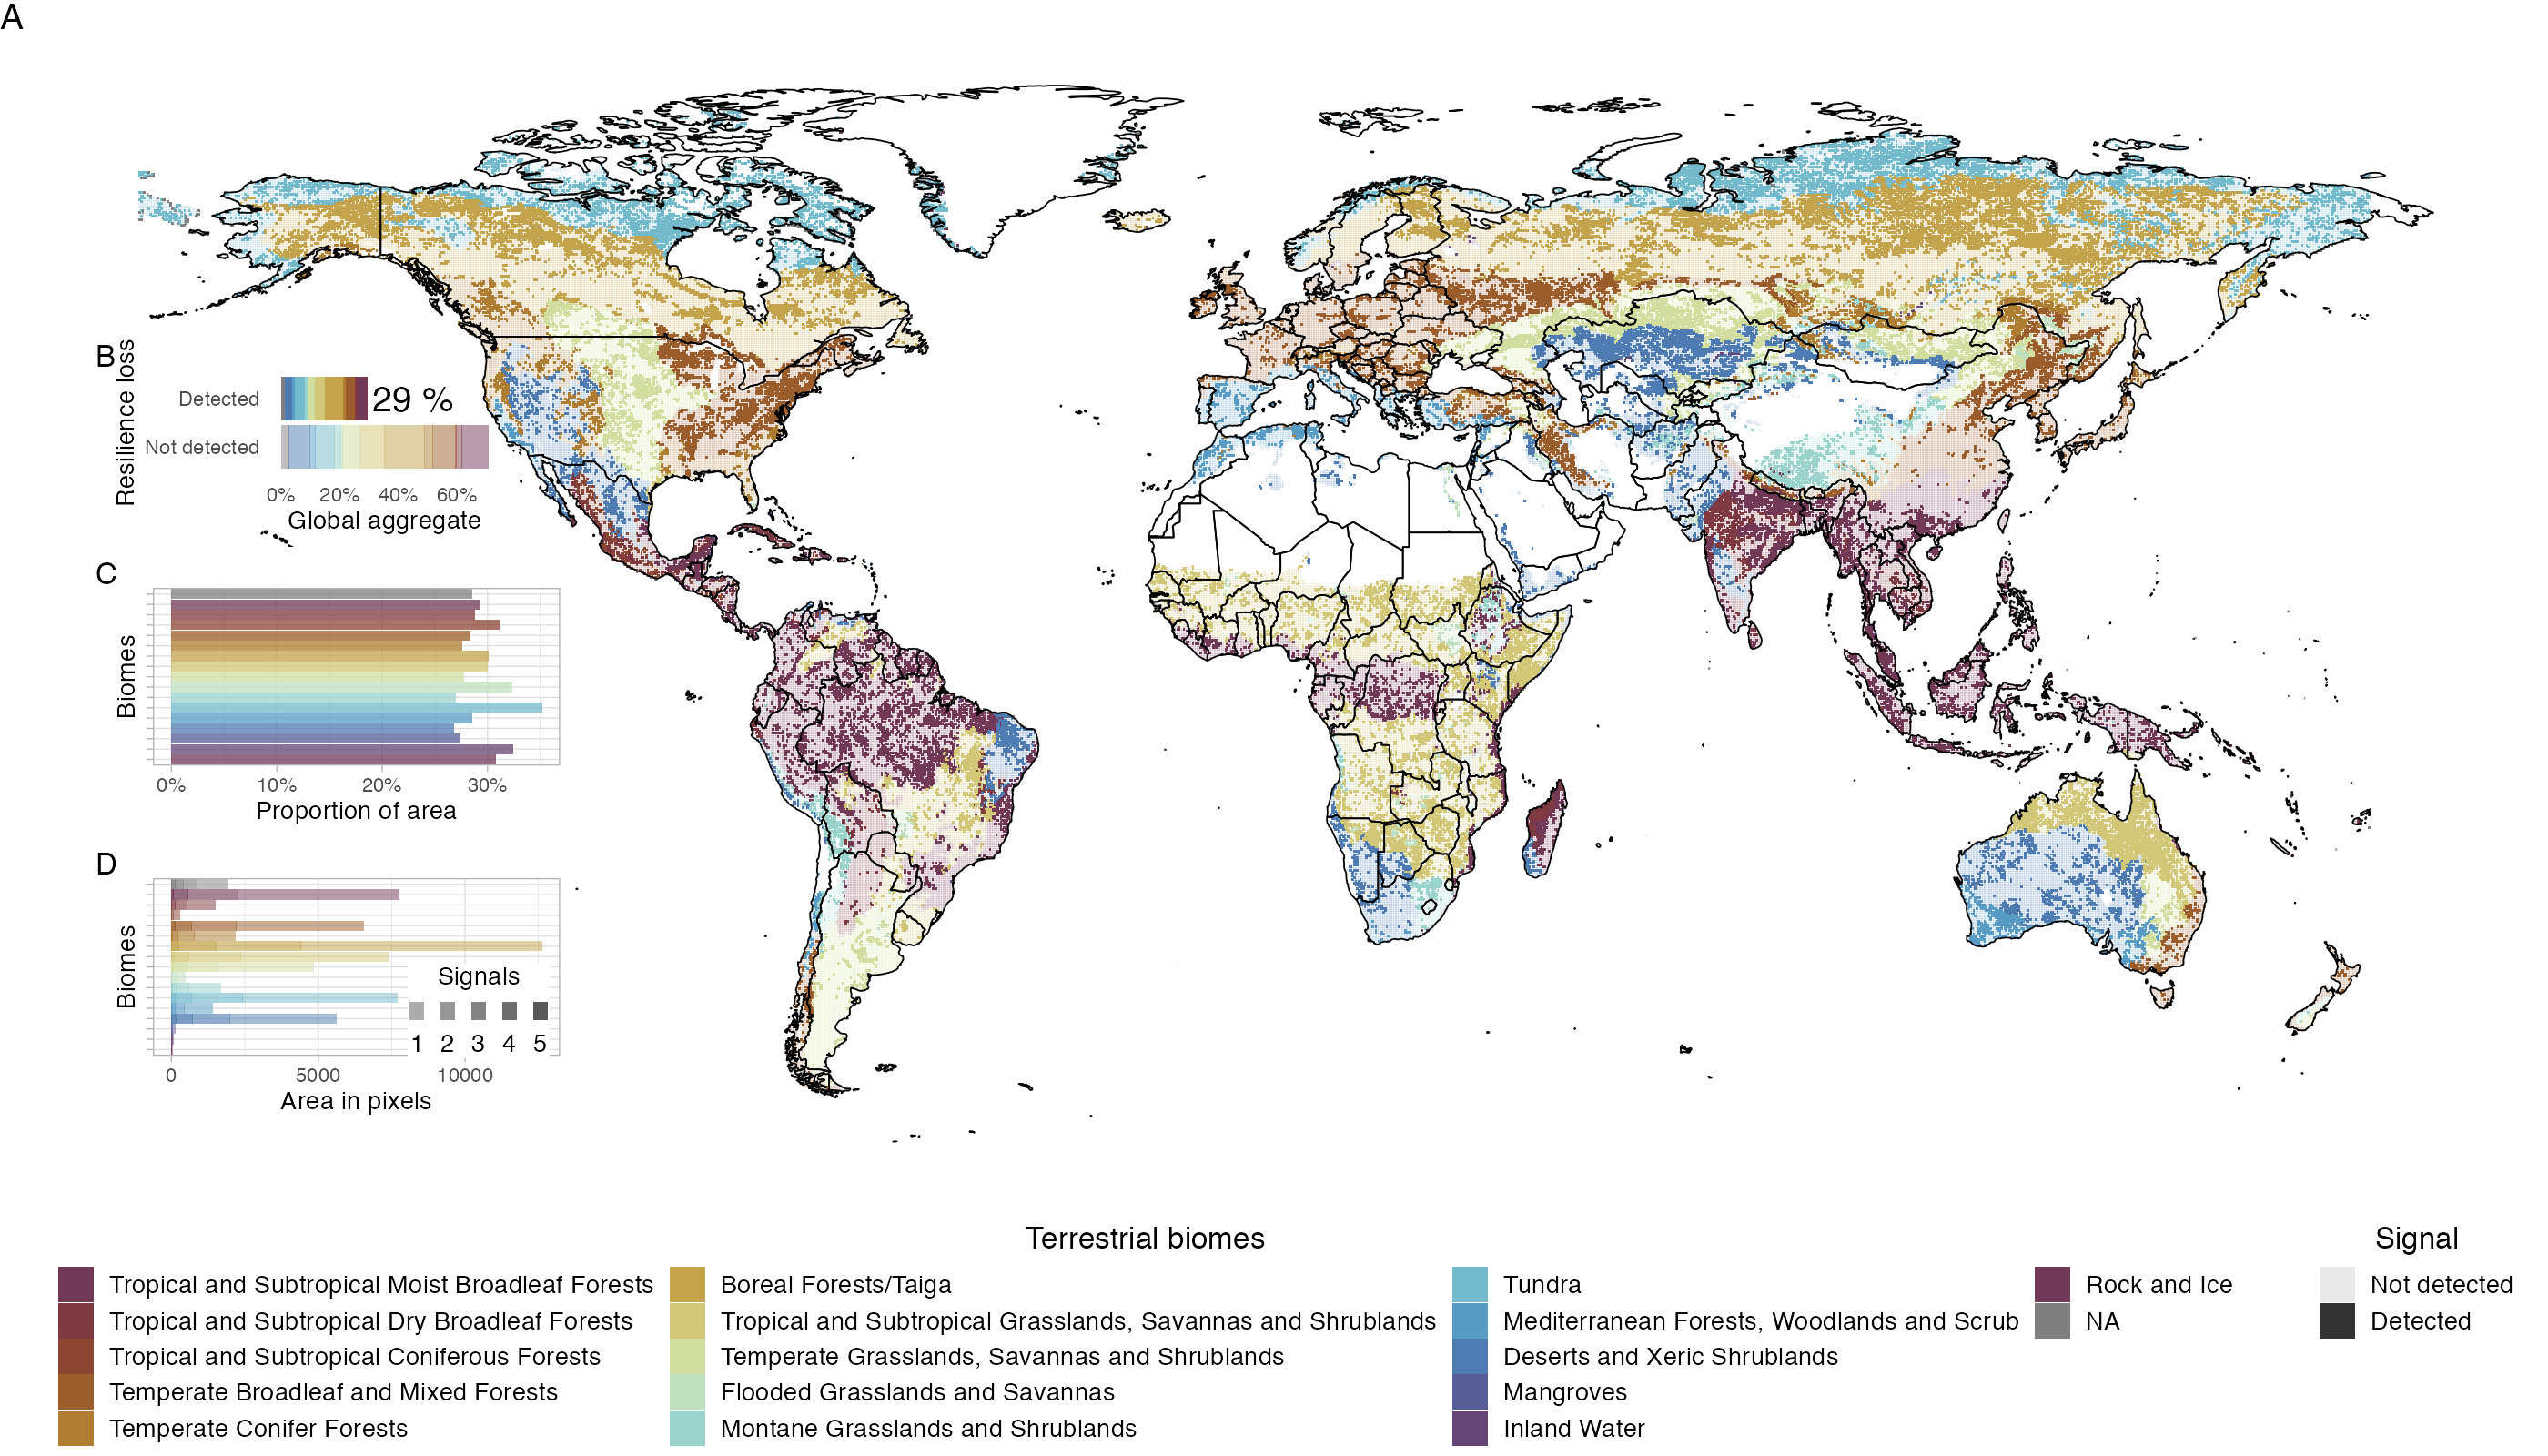
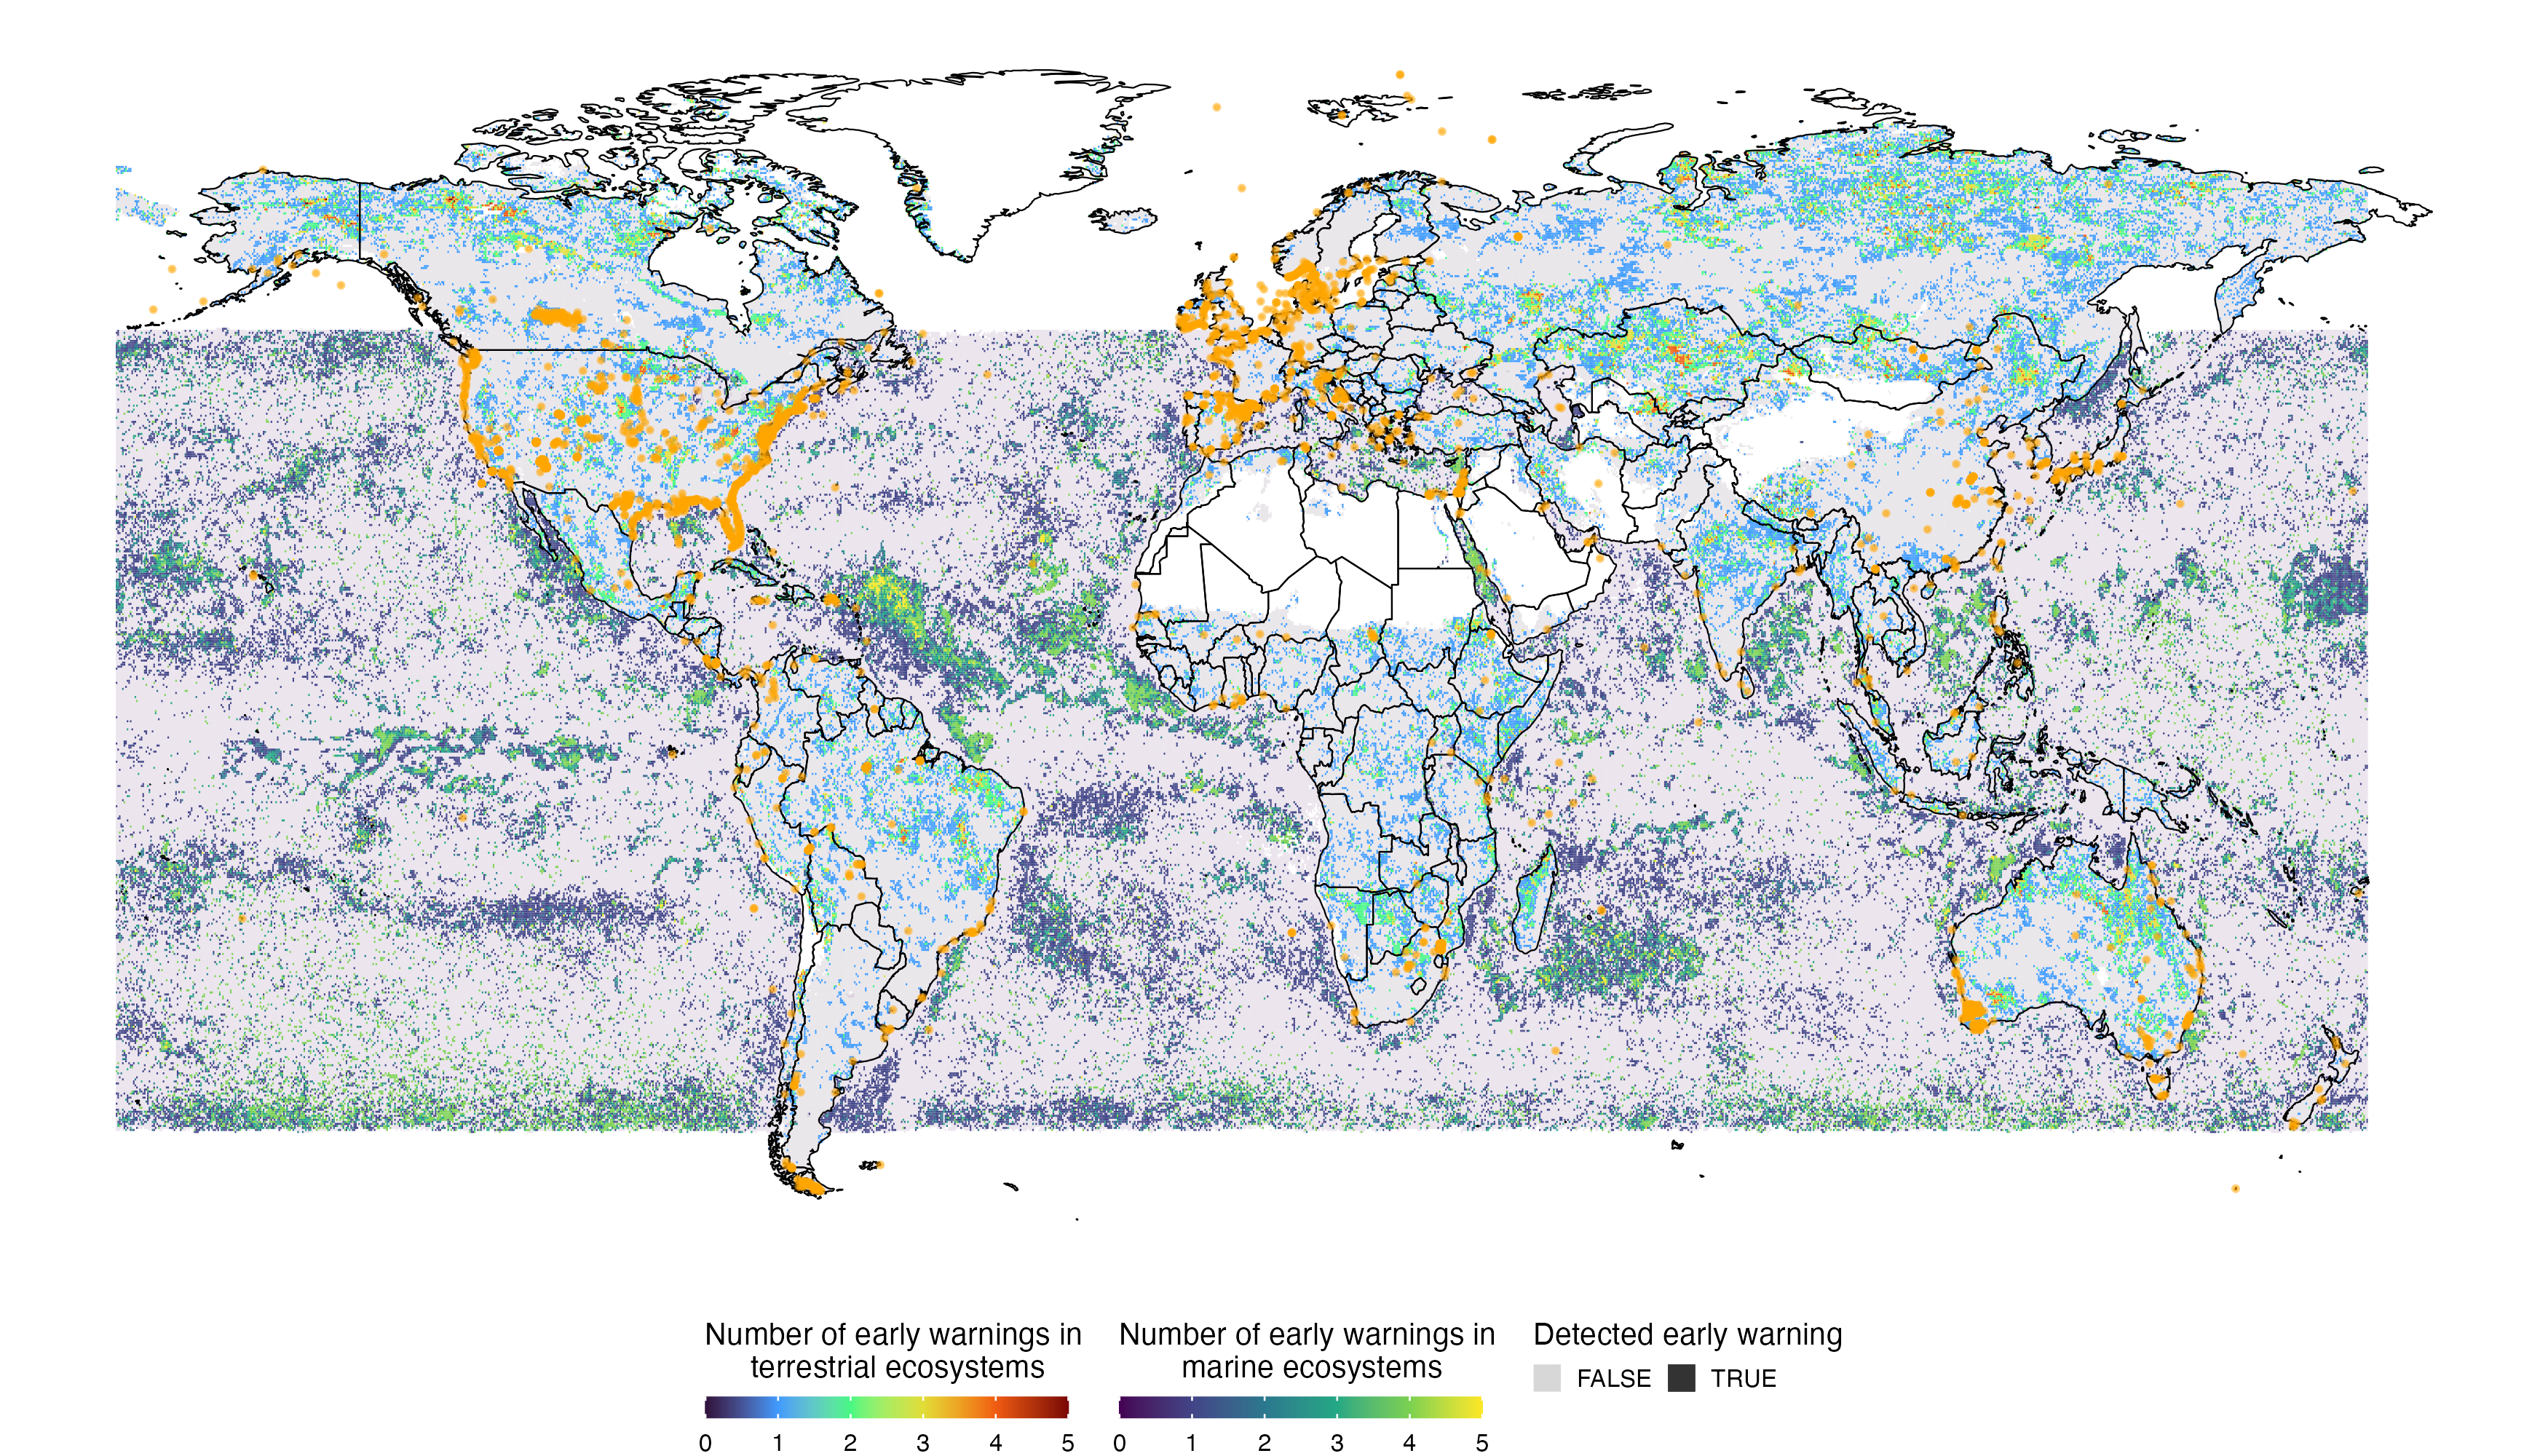
~30% of ecosystem show symptoms of resilience loss, boreal forest and tundra particularly strong signals
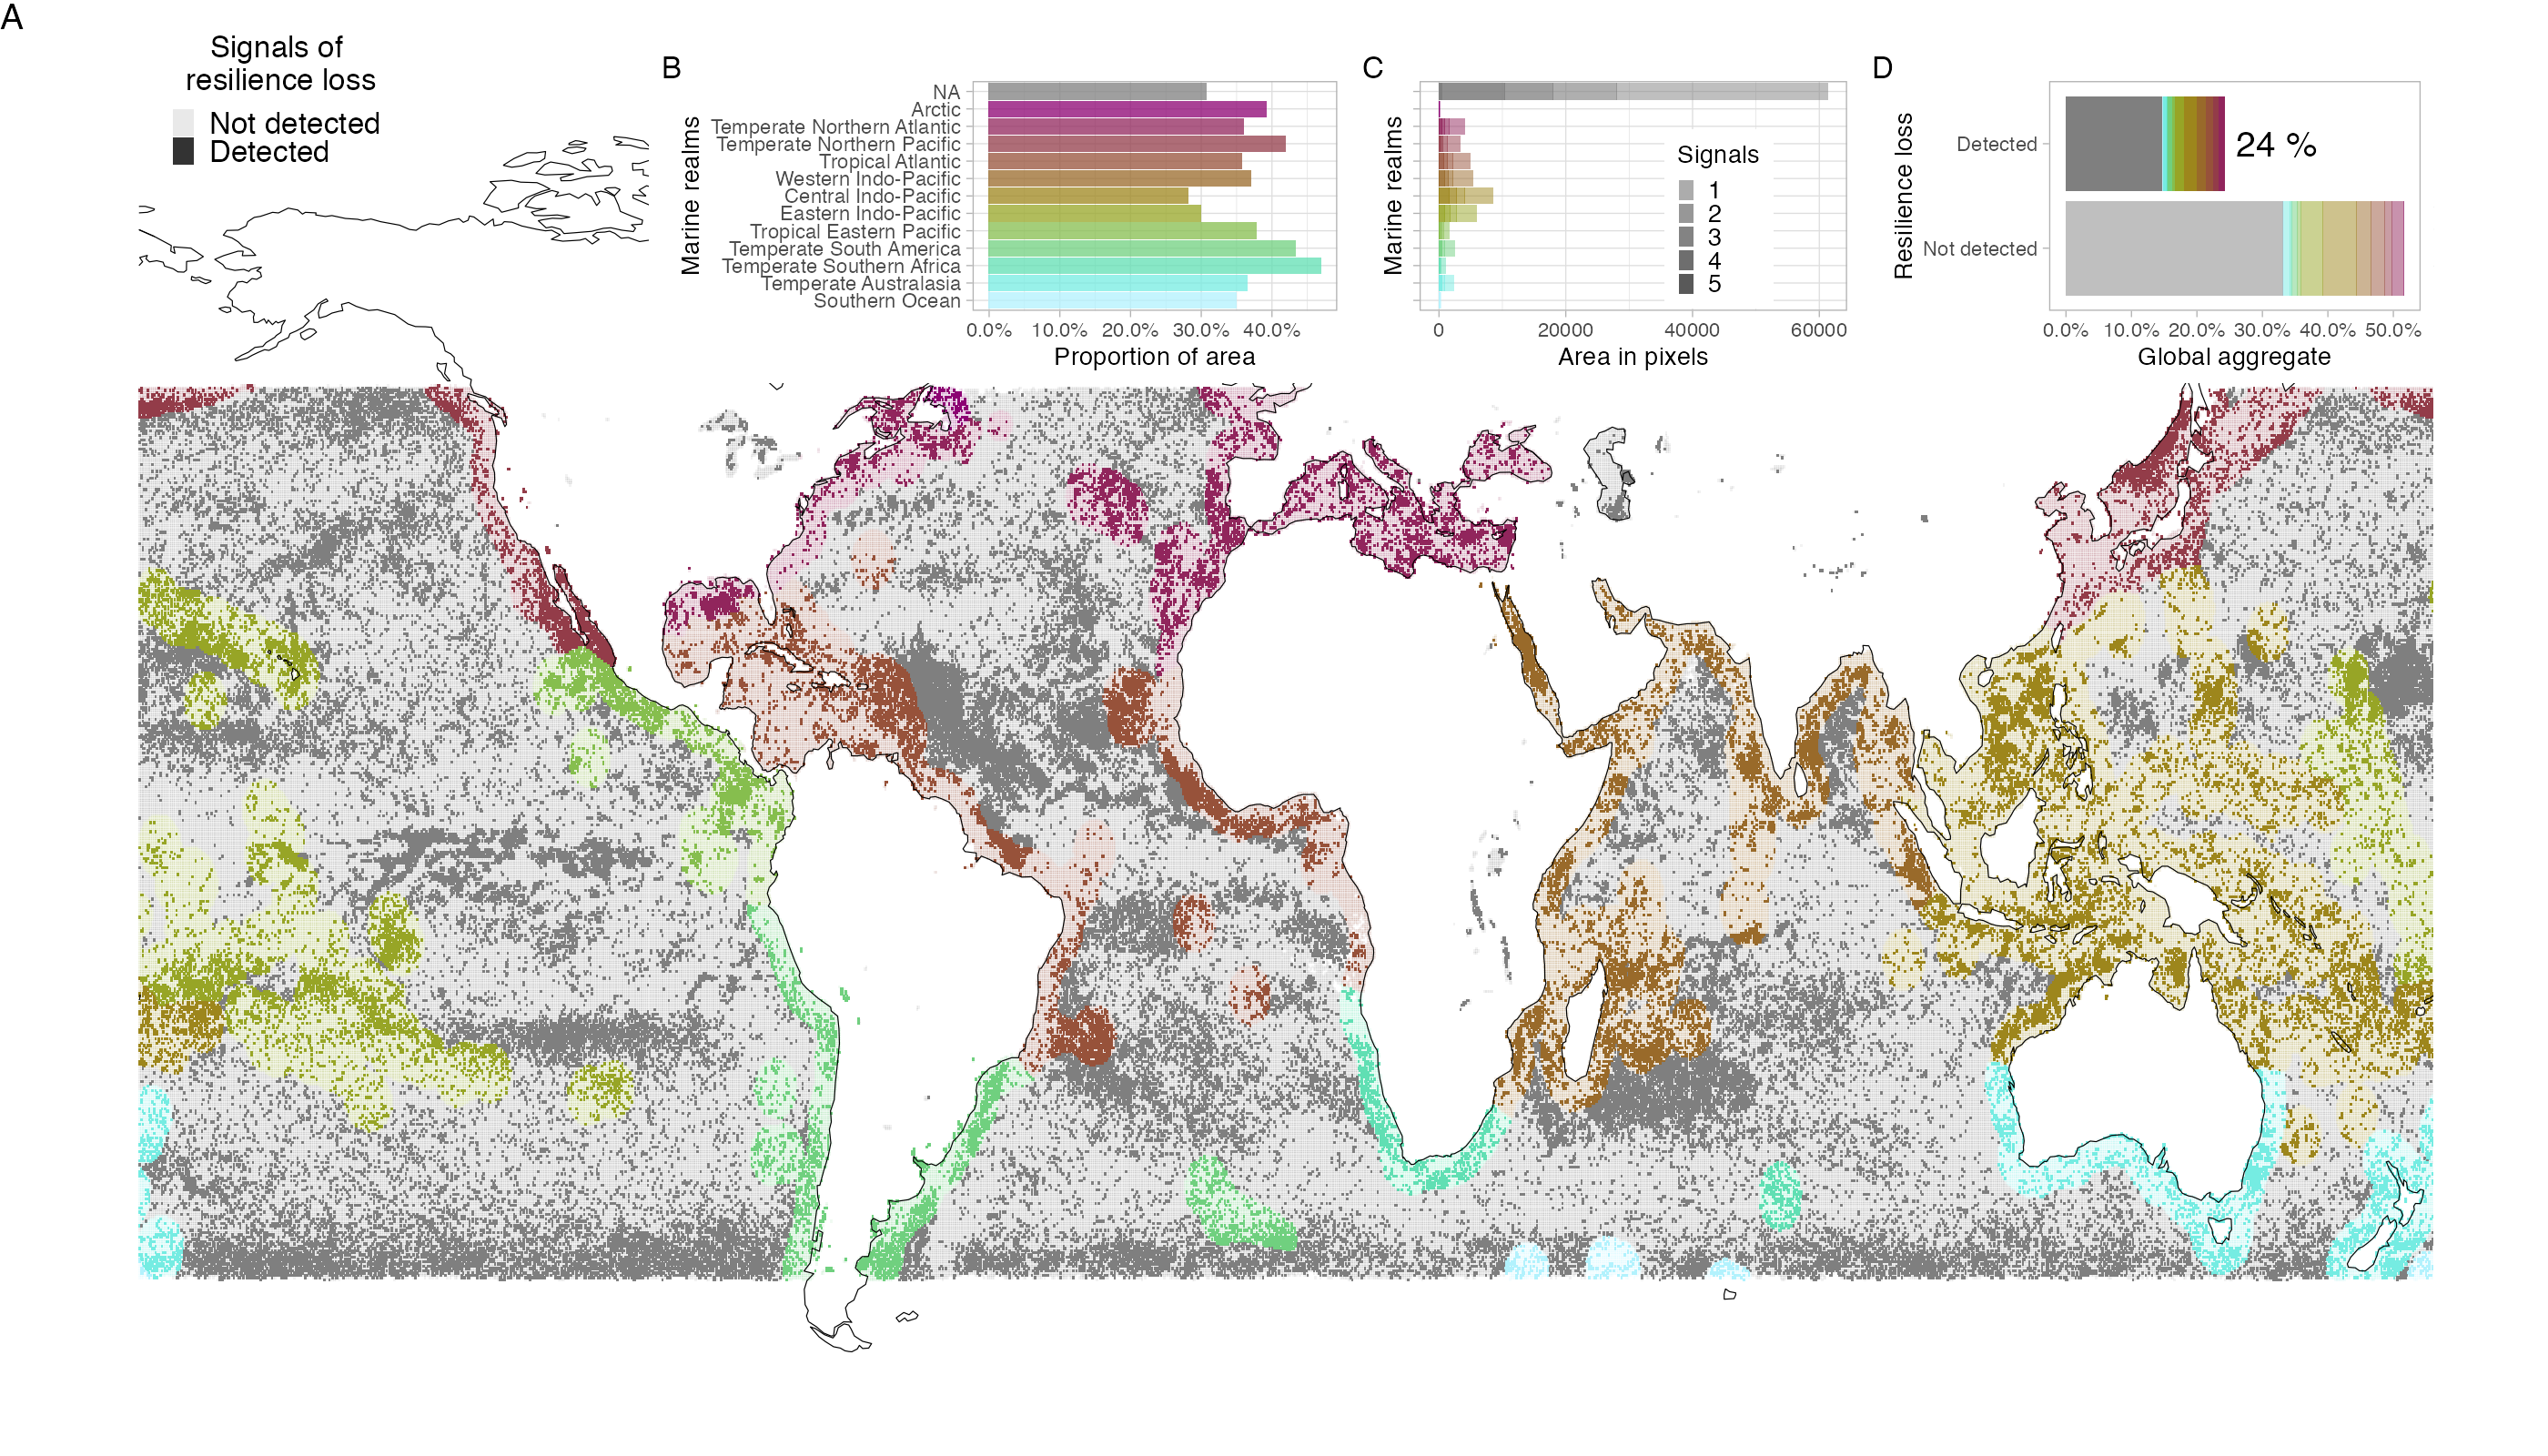
~25% of ecosystem show symptoms of resilience loss, Easter Indo-Pacific and Tropical Eastern Pacific Oceans particularly strong signals
Identify places prone to regime shifts
Places at risk due to drivers or showing symptoms or resilience loss
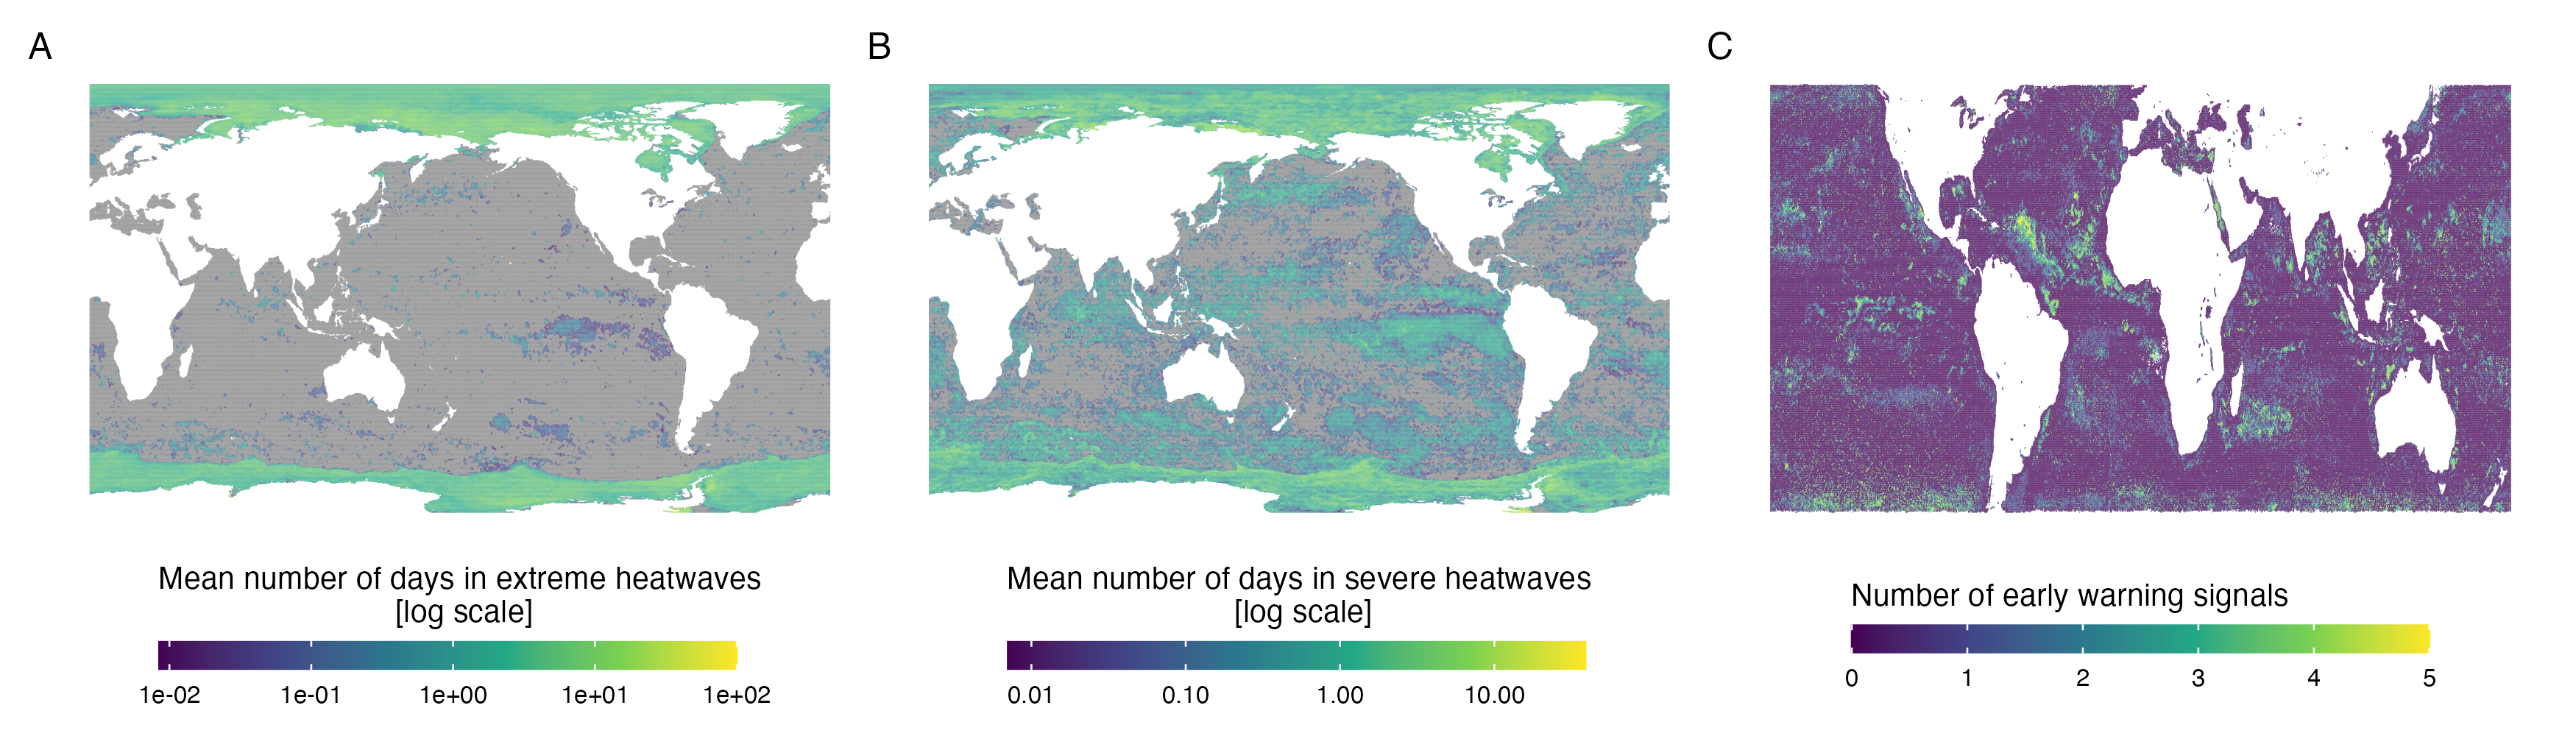
- Heatwaves: event when the SST exceeds the 99th percentile wrt 30yrs ref period\(^1\), severe and extreme events exceed 3 and 4 times the 90th percentile\(^2\)
- NOAA SST observations [1981-2022 at 0.25\(^\circ\)] to calculate heatwave events
- ESA ocean color observations [1998-2018 at 0.25\(^\circ\)] to calculate proxies of resilience loss\(^3\)
\(^1\)Frölicher 2018 Nature ; \(^2\)Hobday 2018 Oceanography ; Smith 2023 Ann. Rev., \(^3\)Rocha 2022 ERL
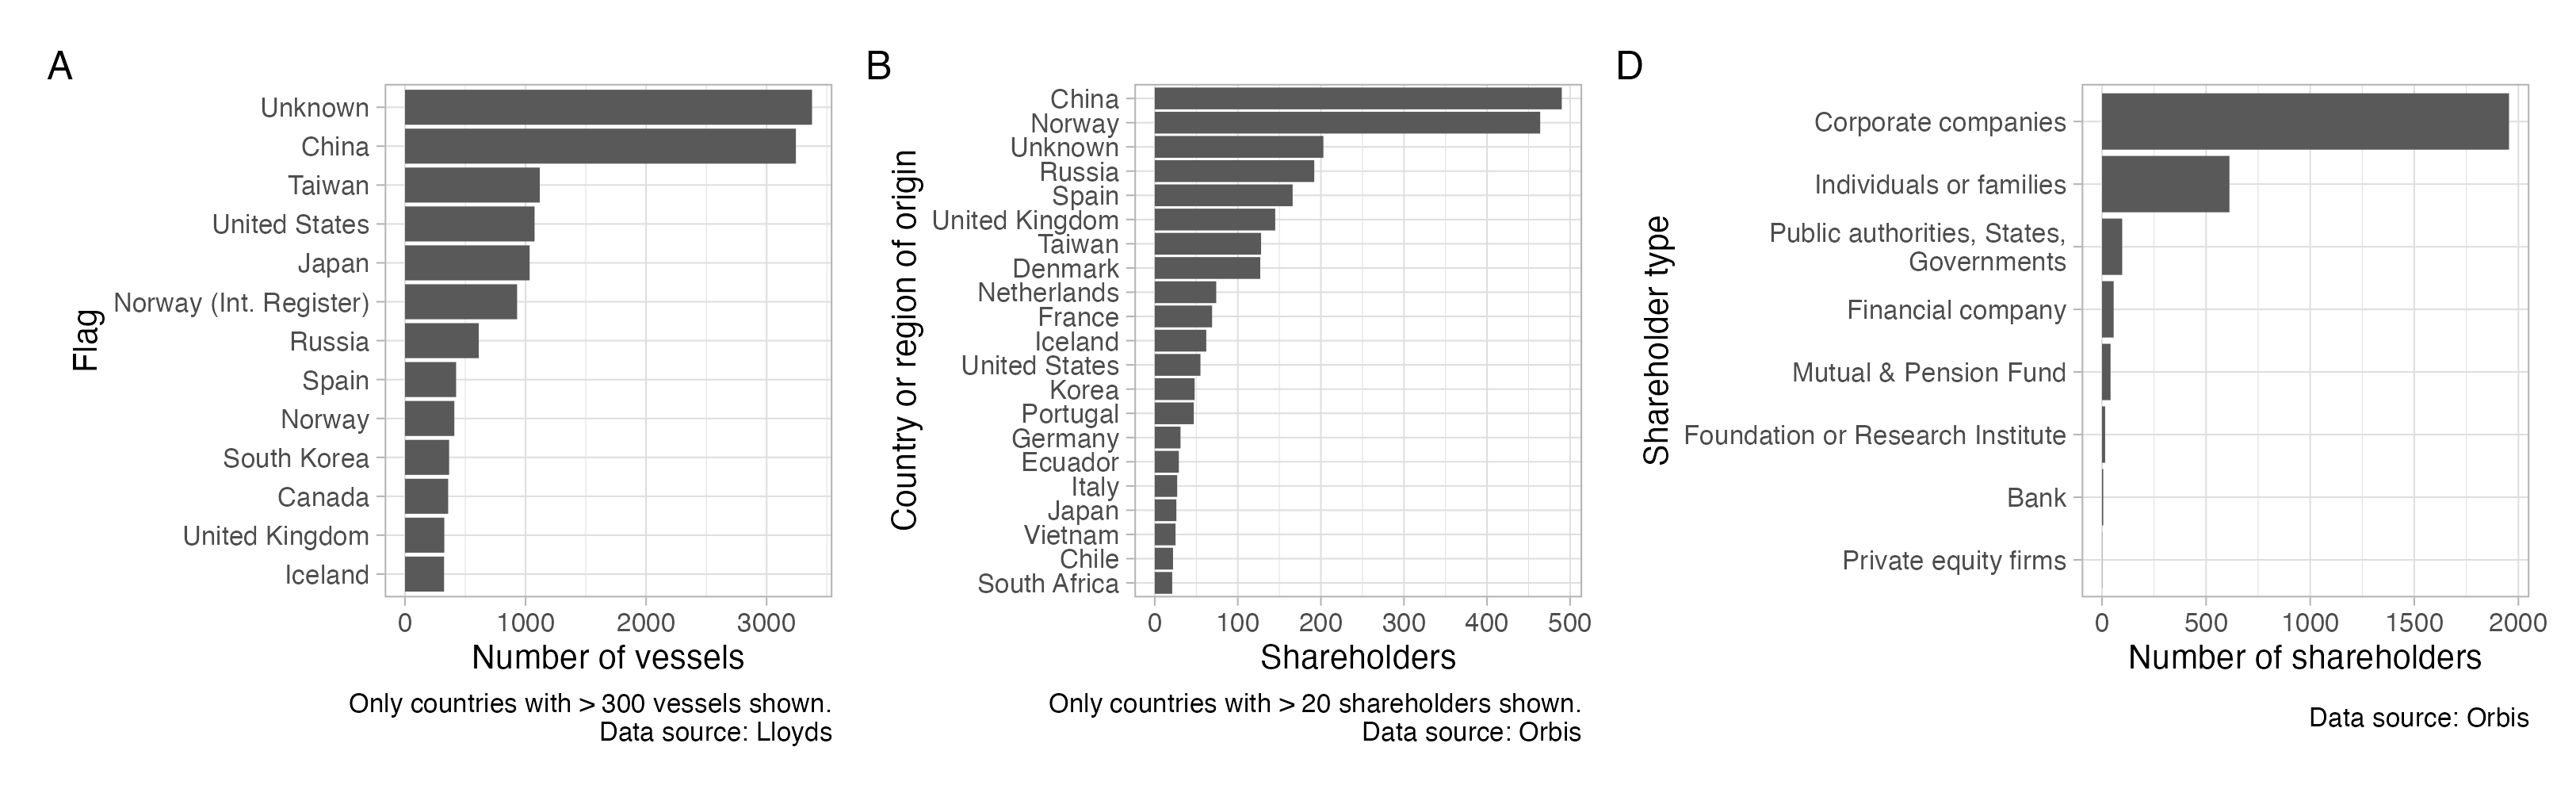
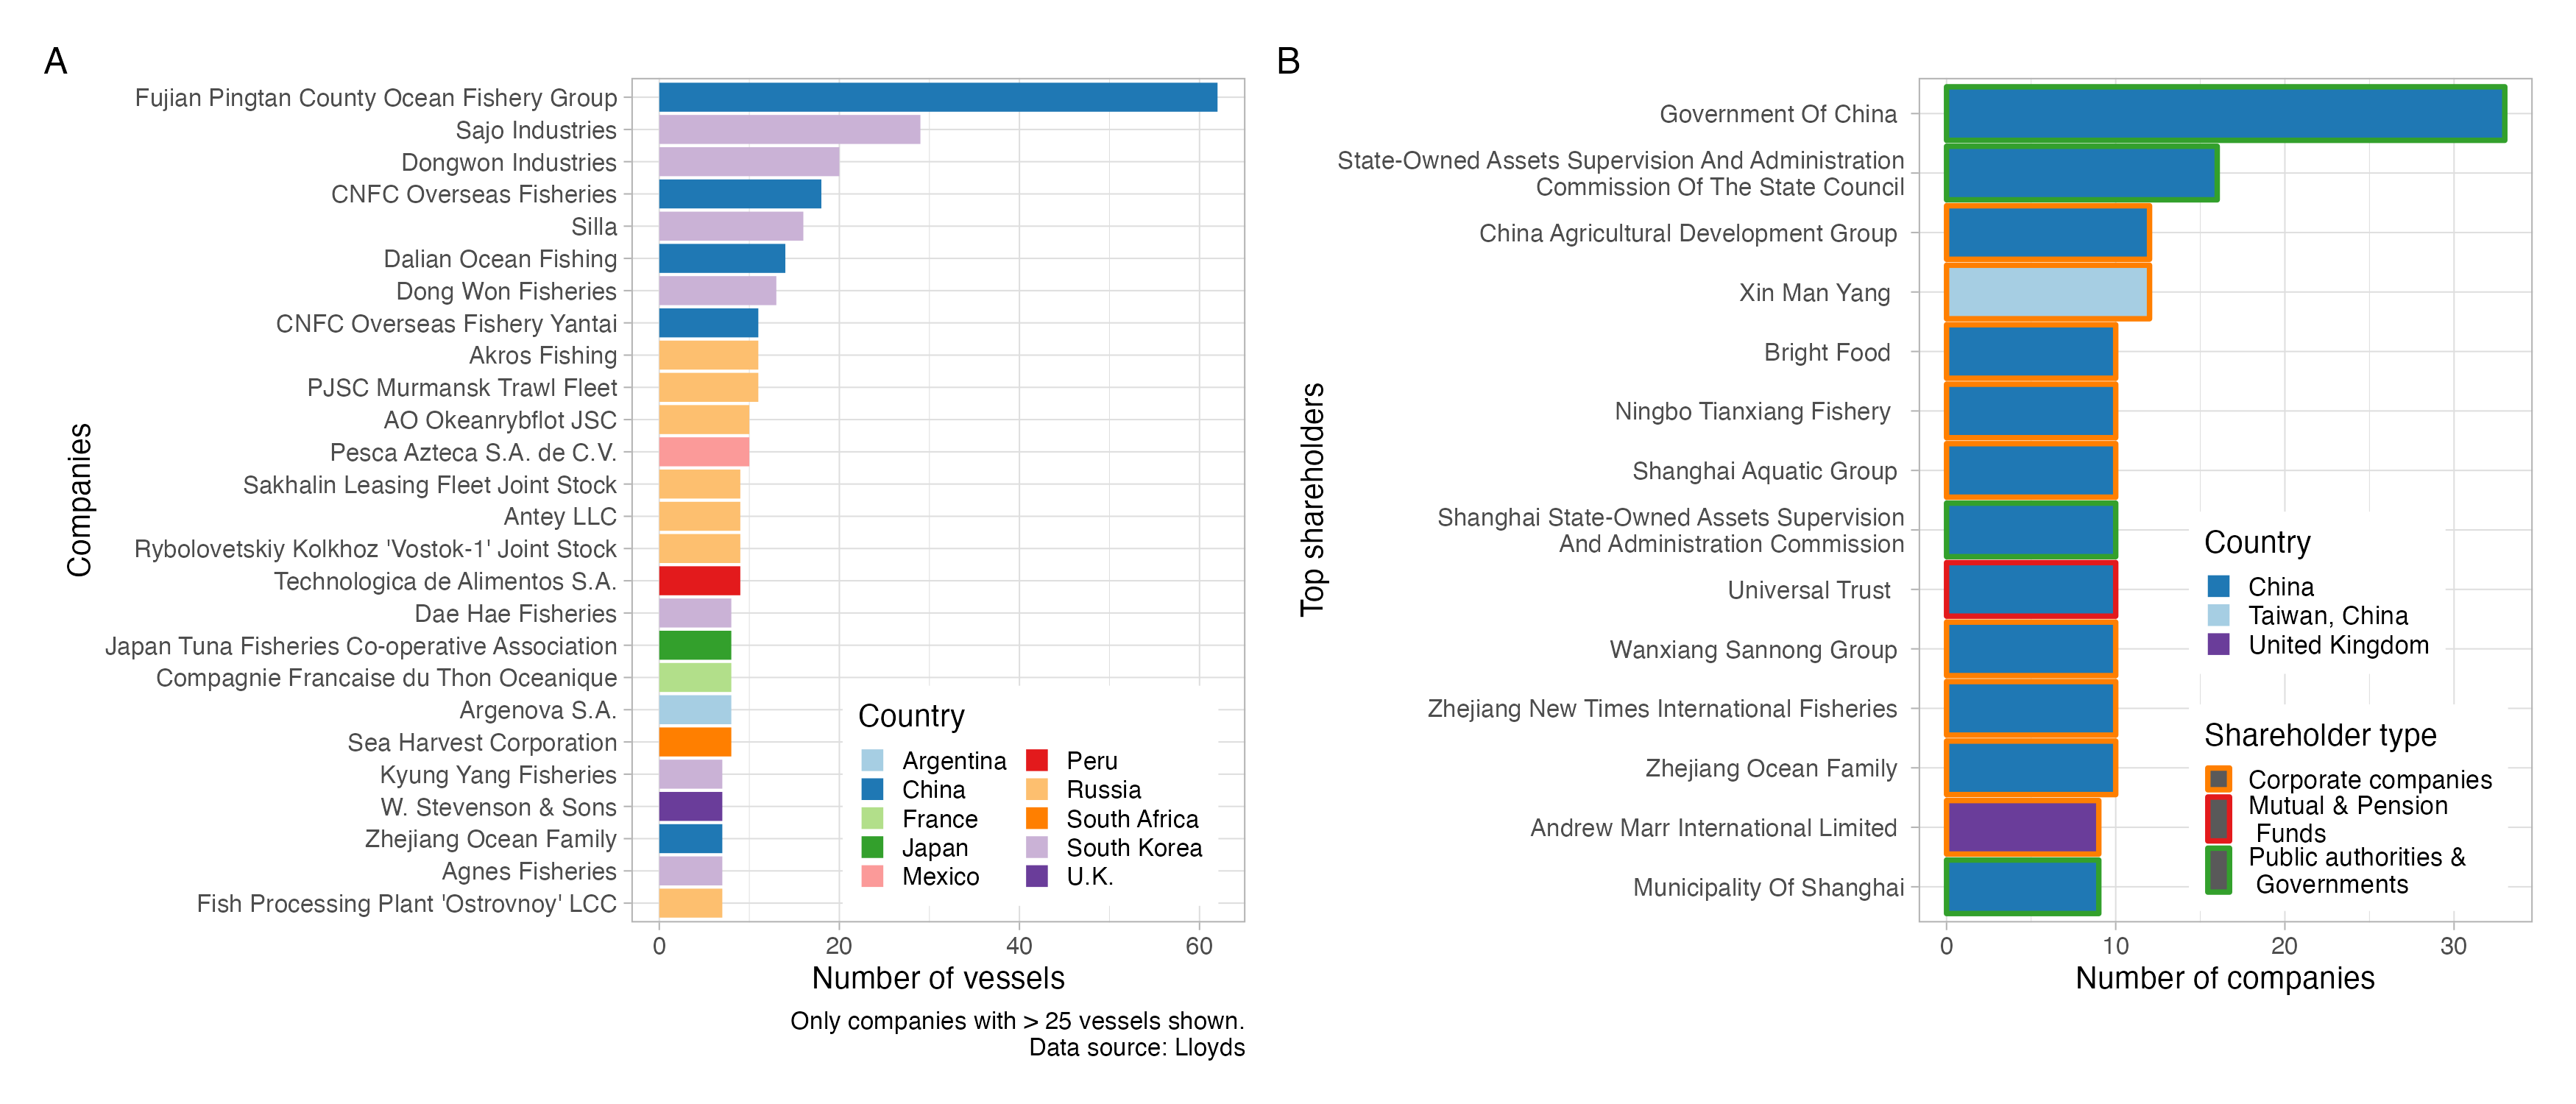
Identify economic activities & companies
- >70k vessels around the world
- 16 878 vessels fishing in high risk areas
- Currently 2981 companies (Lloyds)
- For 855: 1825 shareholders (Orbis)
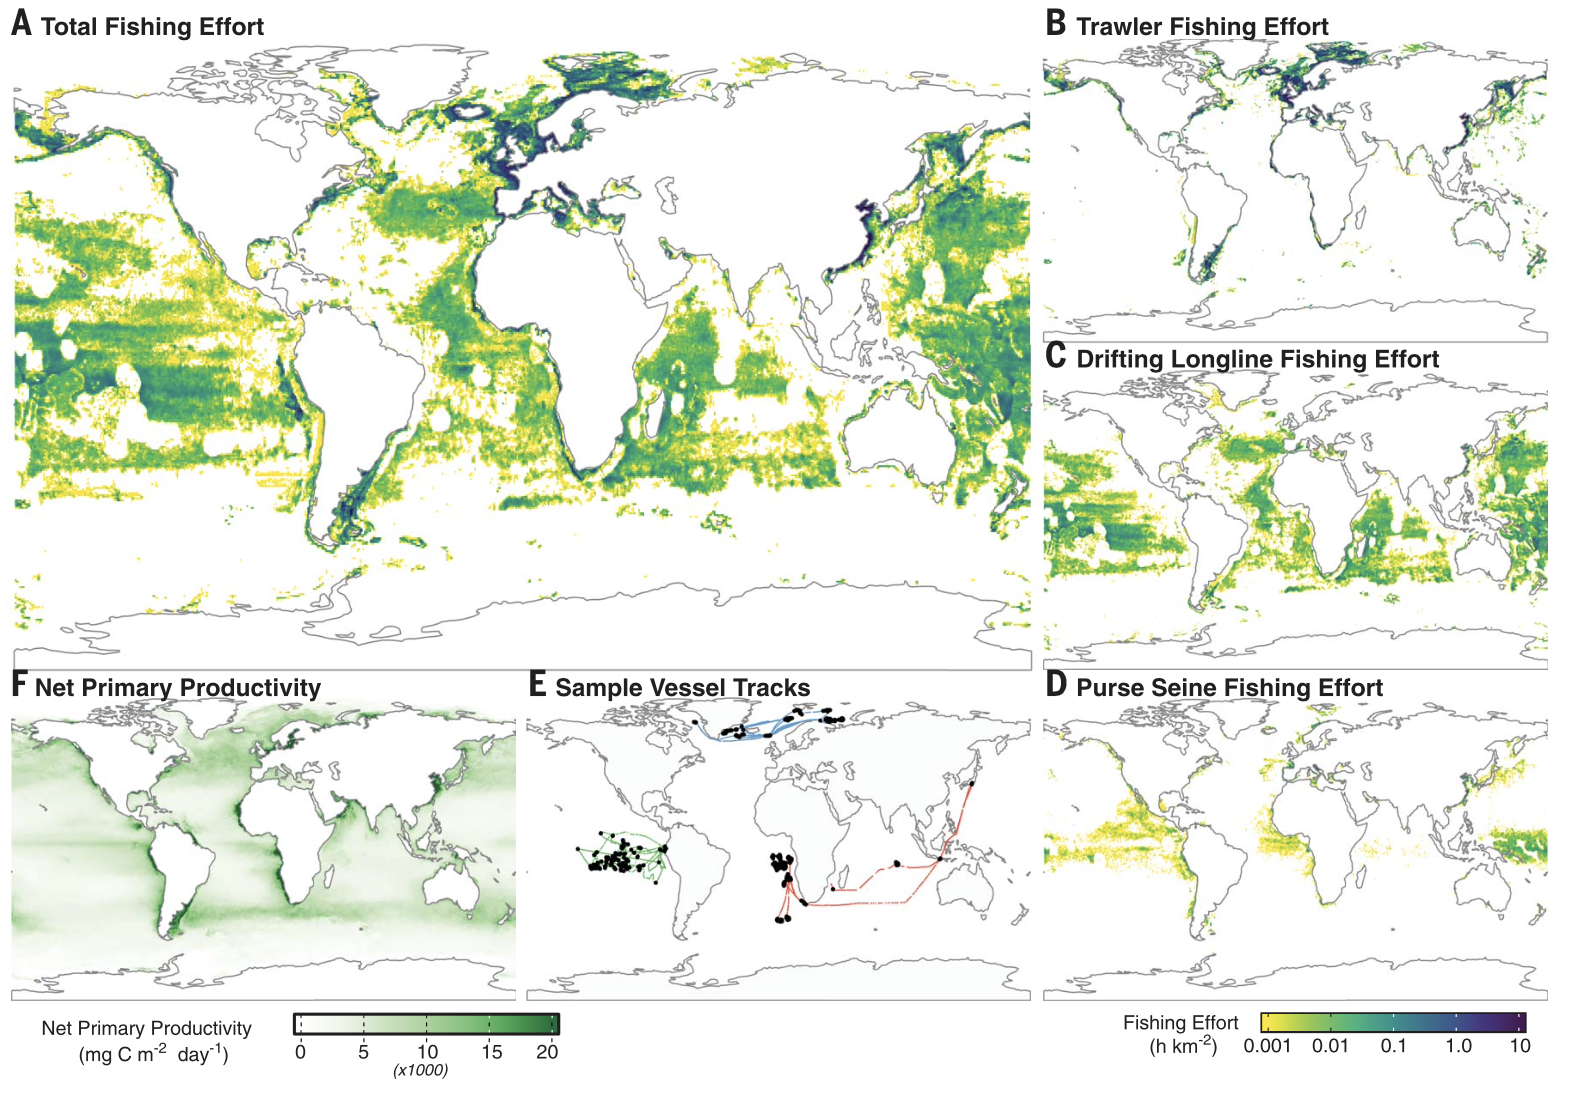
Kroodsma 2018 Science (N = 70k vessels)
Global Fish Watch V2.0 (N = 114k vessels)
Who can make a difference?
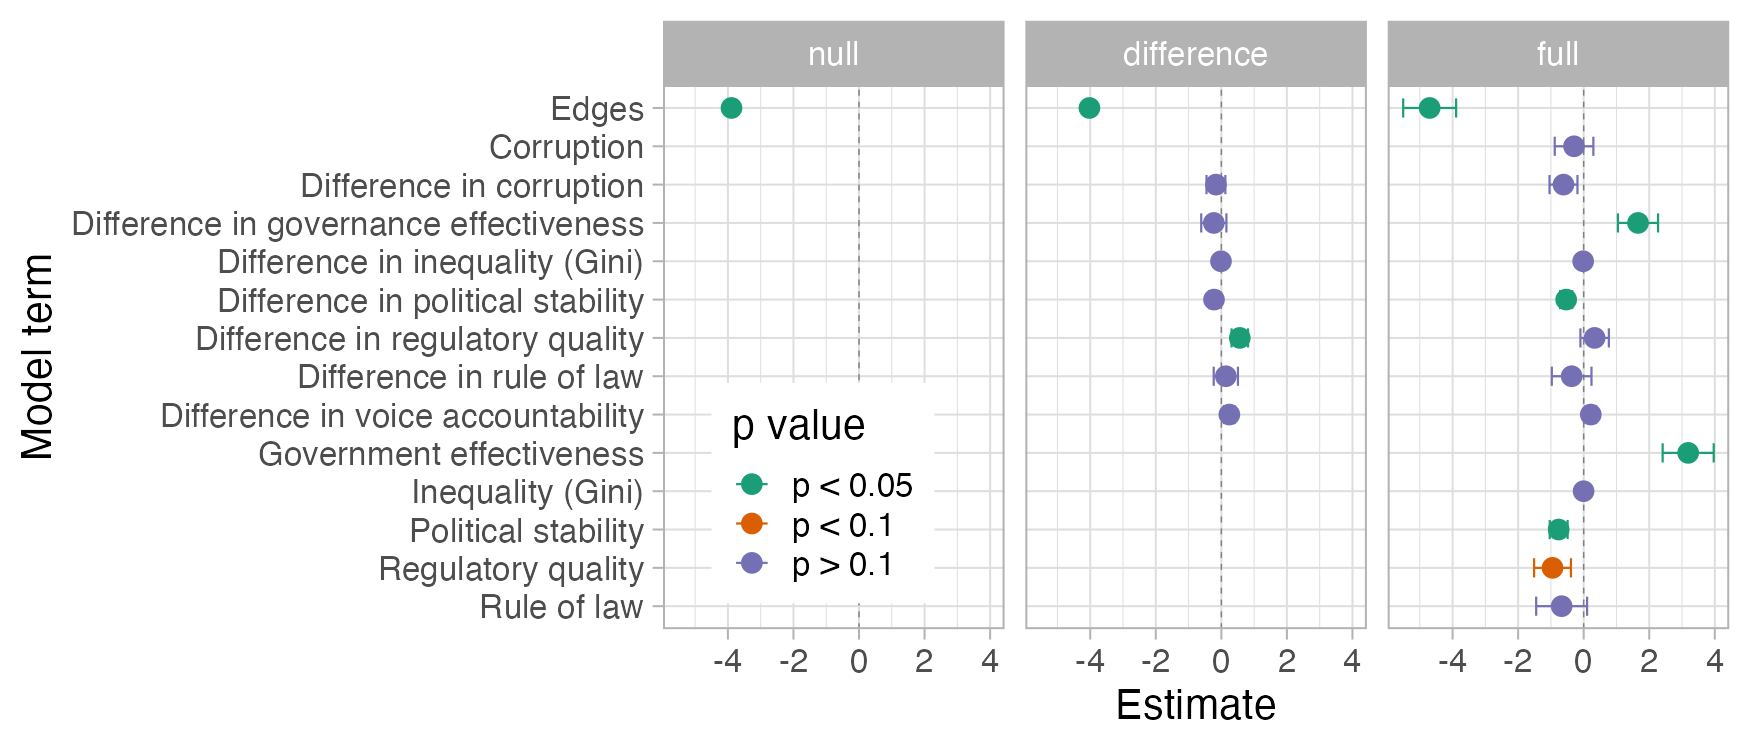
Networks: micro-macro dynamics
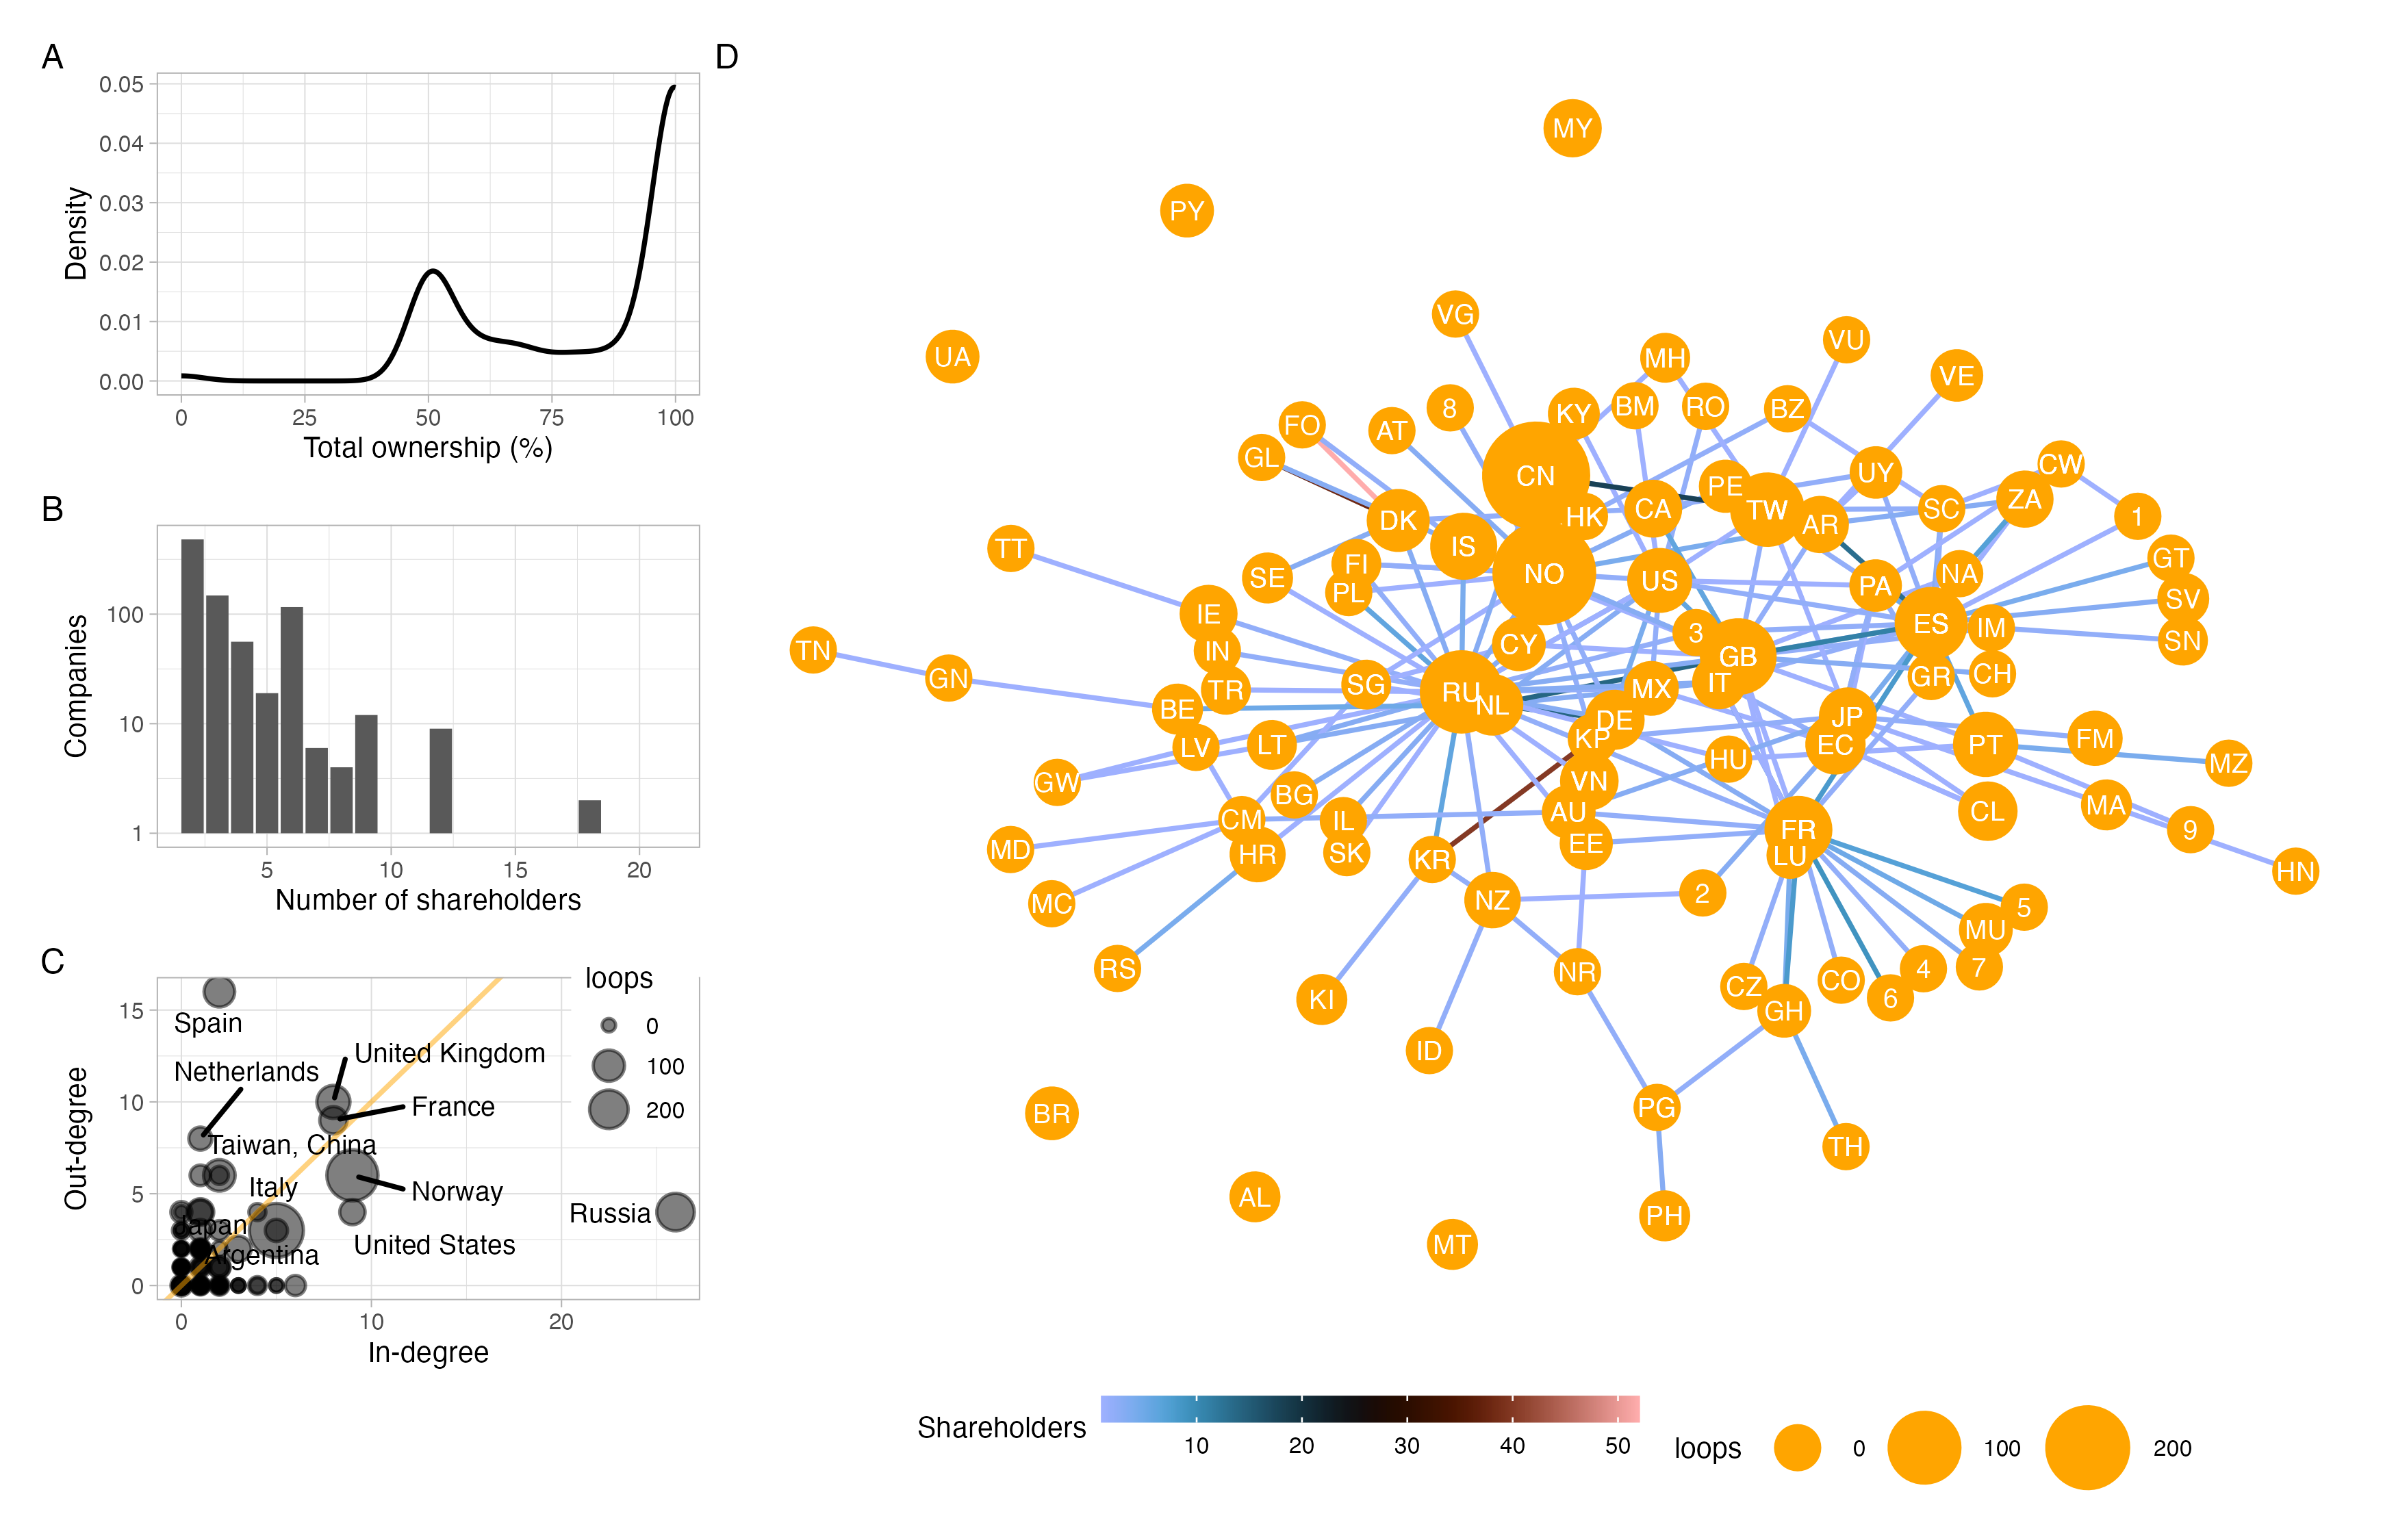
Networks: micro-macro dynamics
Conclusions
- Ecosystems around the world are showing symptoms of resilience loss
- ~30% of terrestrial and ~25% of marine areas
- Identify who is exposed and can do something about it
- Identify areas for management
Questions?: juan.rocha@su.se
![]()