Early Warnings of Regime Shifts
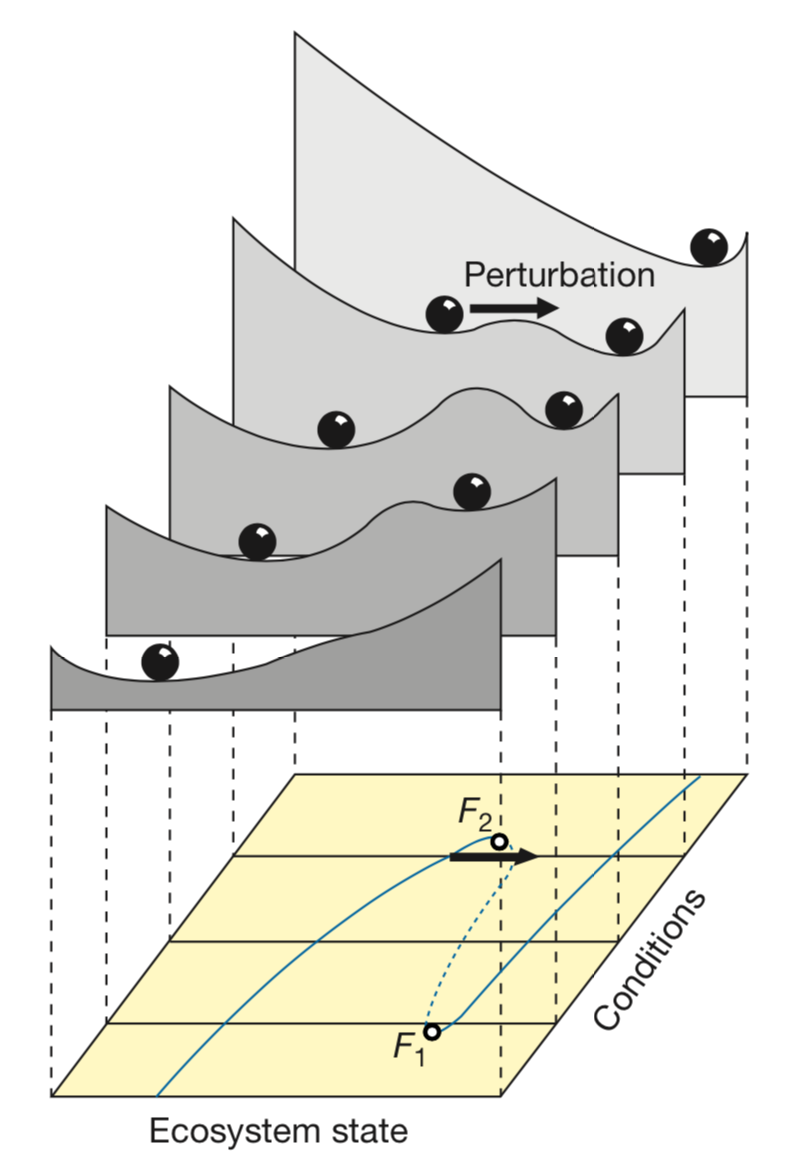
Regime shifts and resilience
Magnitude of change that a system can absorb without undergoing a regime shift
- Size of the basin of attraction
- Depth
- Slope
- Proximity to the boundary
- Property of the system or the regime (state variable)?
- Property of the disturbance?
- Resilience of what to what? for whom?
Holling C. 1973. Ann Rev Ecol Syst -> Clark, W 1975 IIASA
Menck et al 2013 NatPhys
Carpenter et al 2001 Ecosystems
Back to theory: Where is the tipping point?
\[\frac{d🐠}{d⏱️}=🐠 \left( 1- \frac{🐠}{🌎} \right) - 🎣 \left( \frac{🐠^2}{🐠^2+1} \right)\]
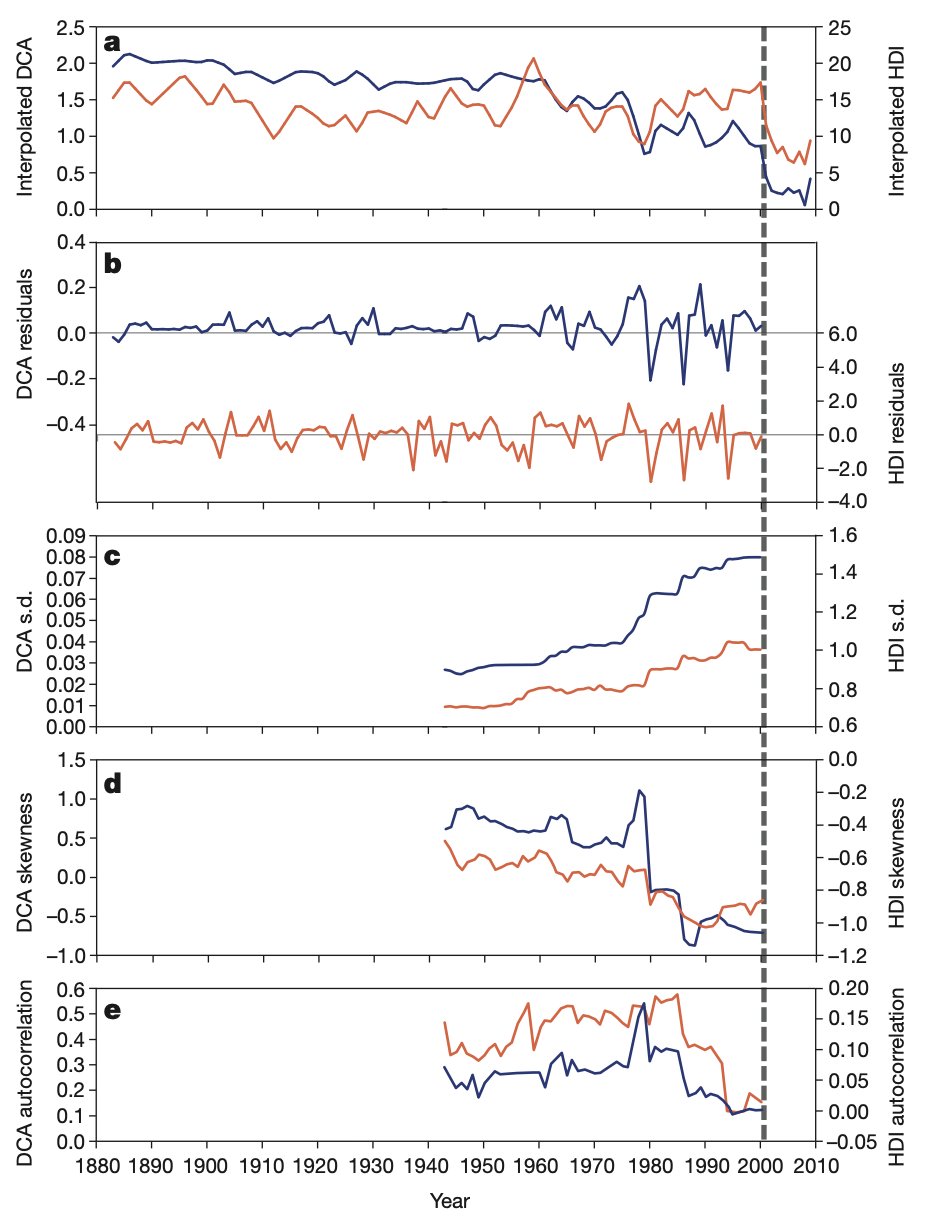
Resilience indicators
Resilience indicators
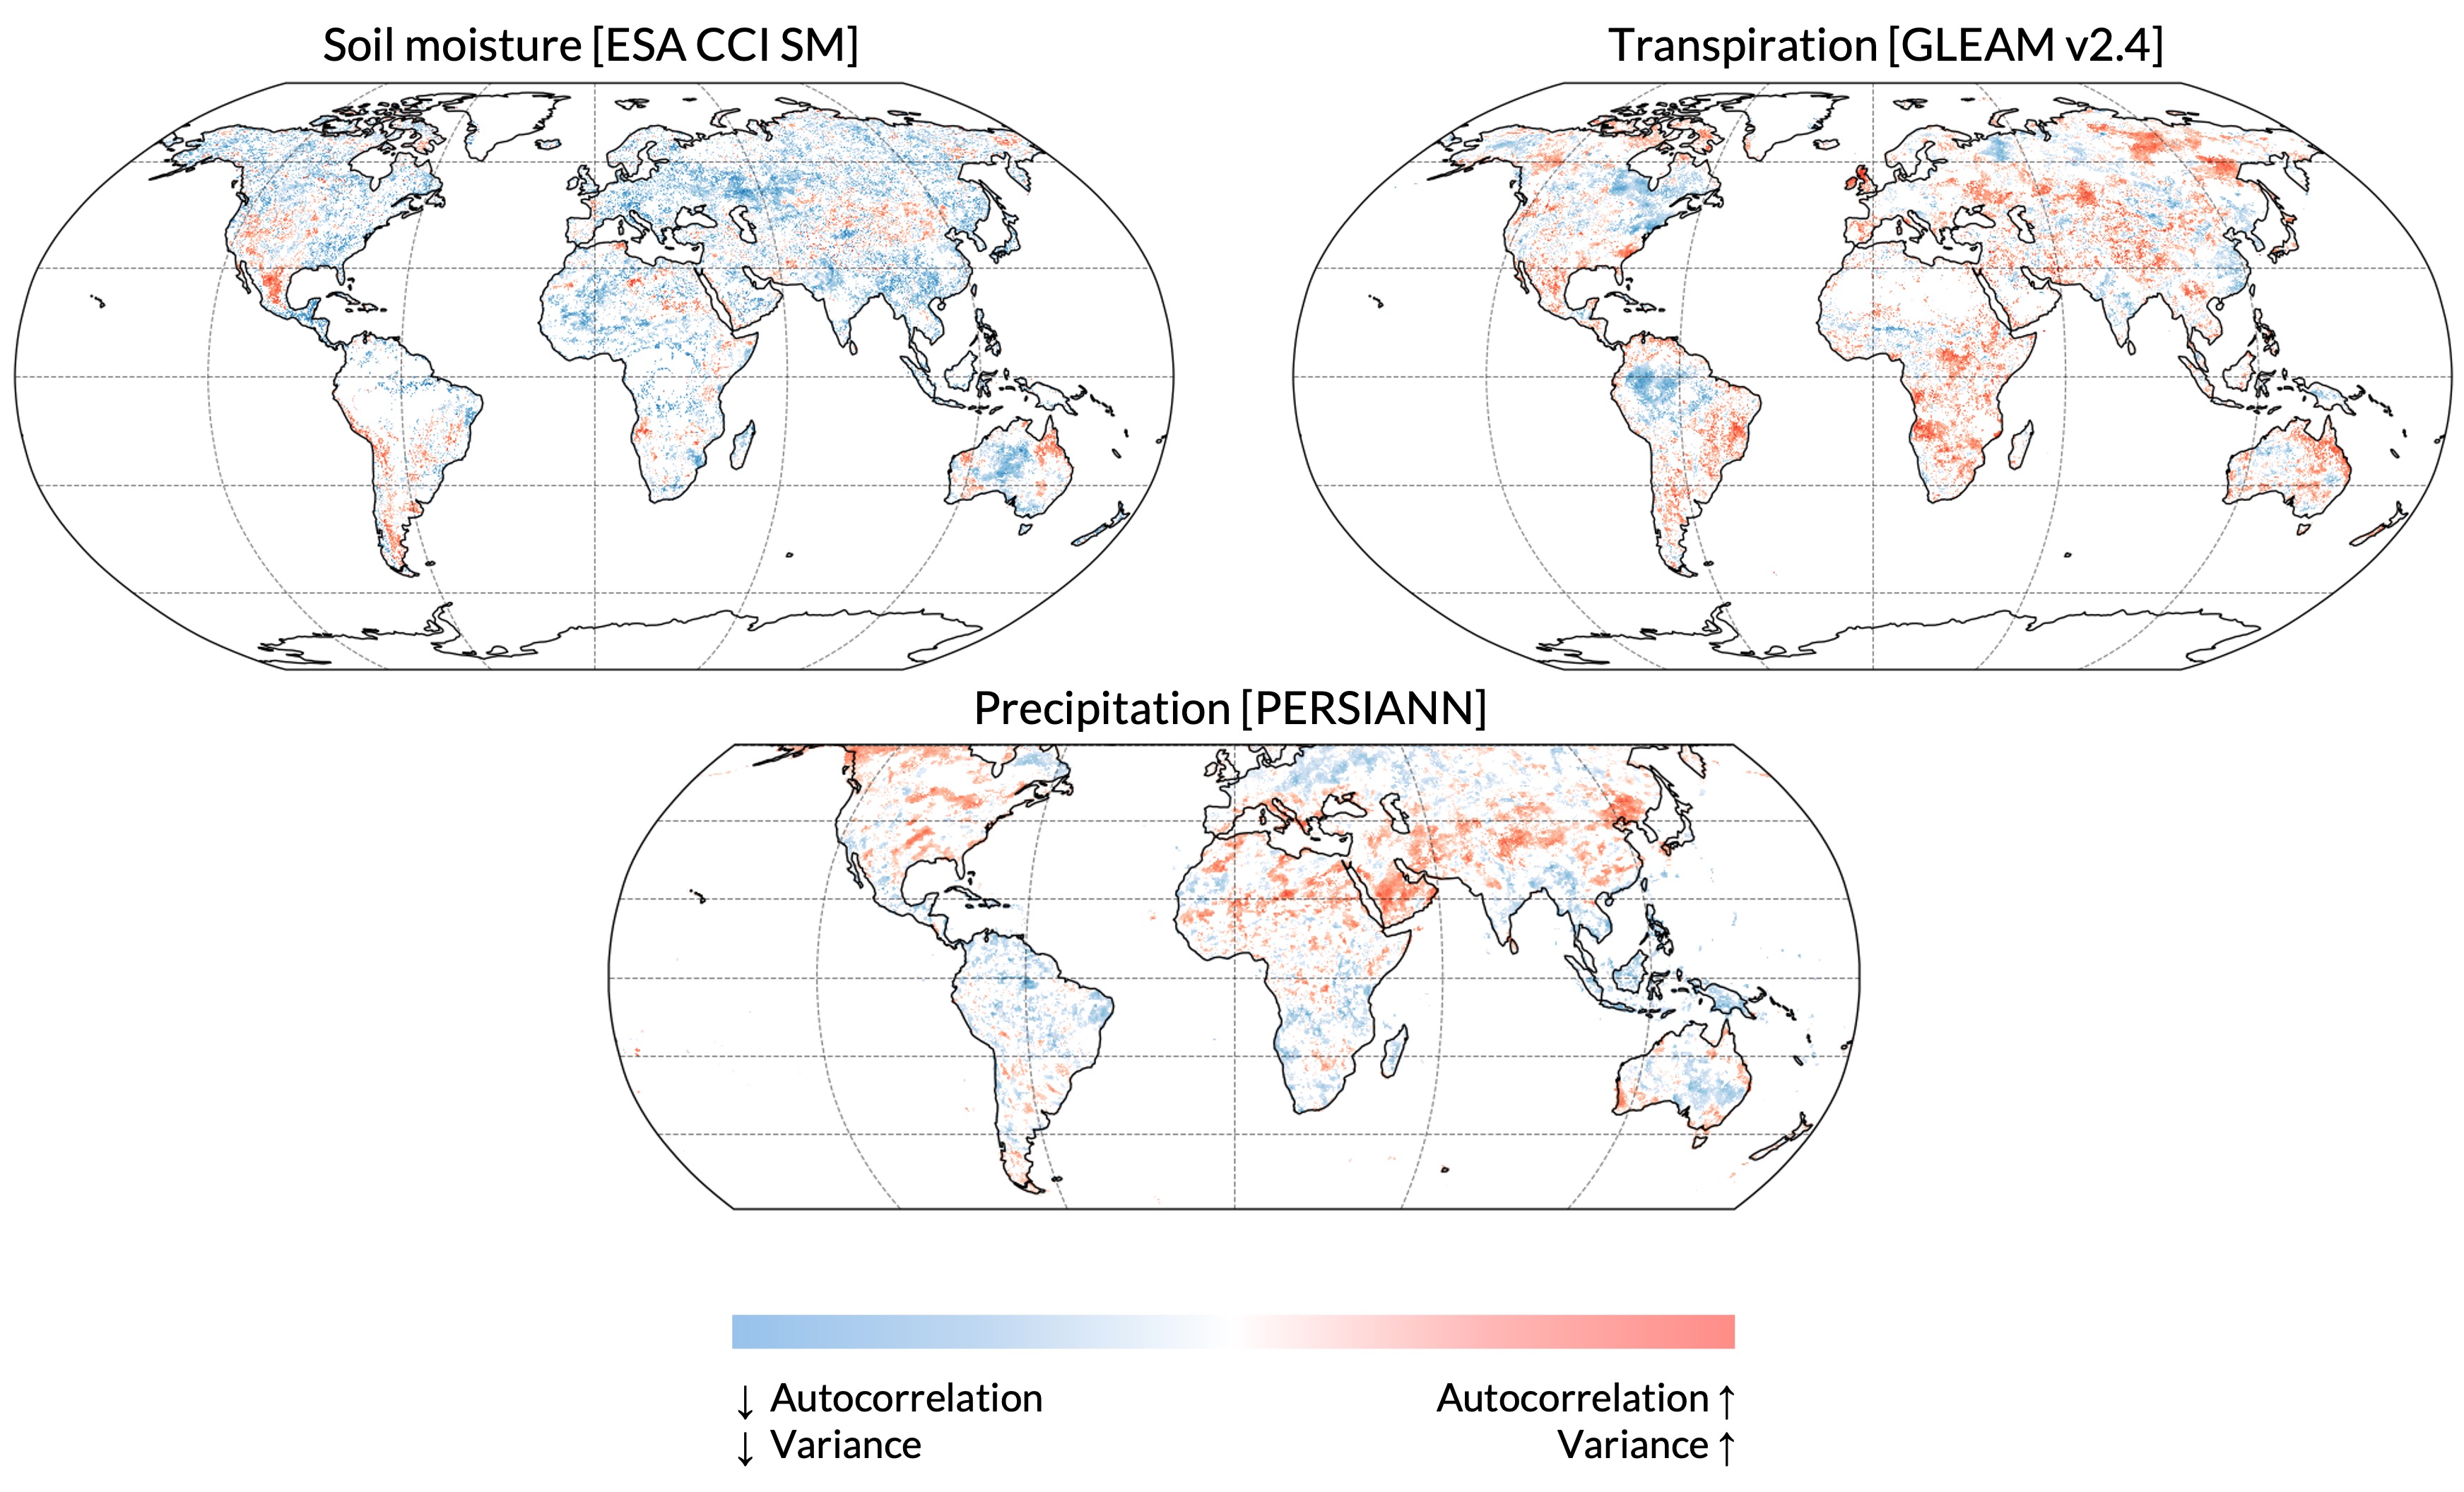
- \(\Delta\) Variance and autocorrelation
- \(\Delta\) skewness and kurtosis
- Model-based indicators:
- Diffusion jump models
- Time varying AR(p) models
- Threshold AR(p) models
- Potential analysis
- Spatial indicators:
- Fourier transforms
- Power spectrum
- Patch-size distributions
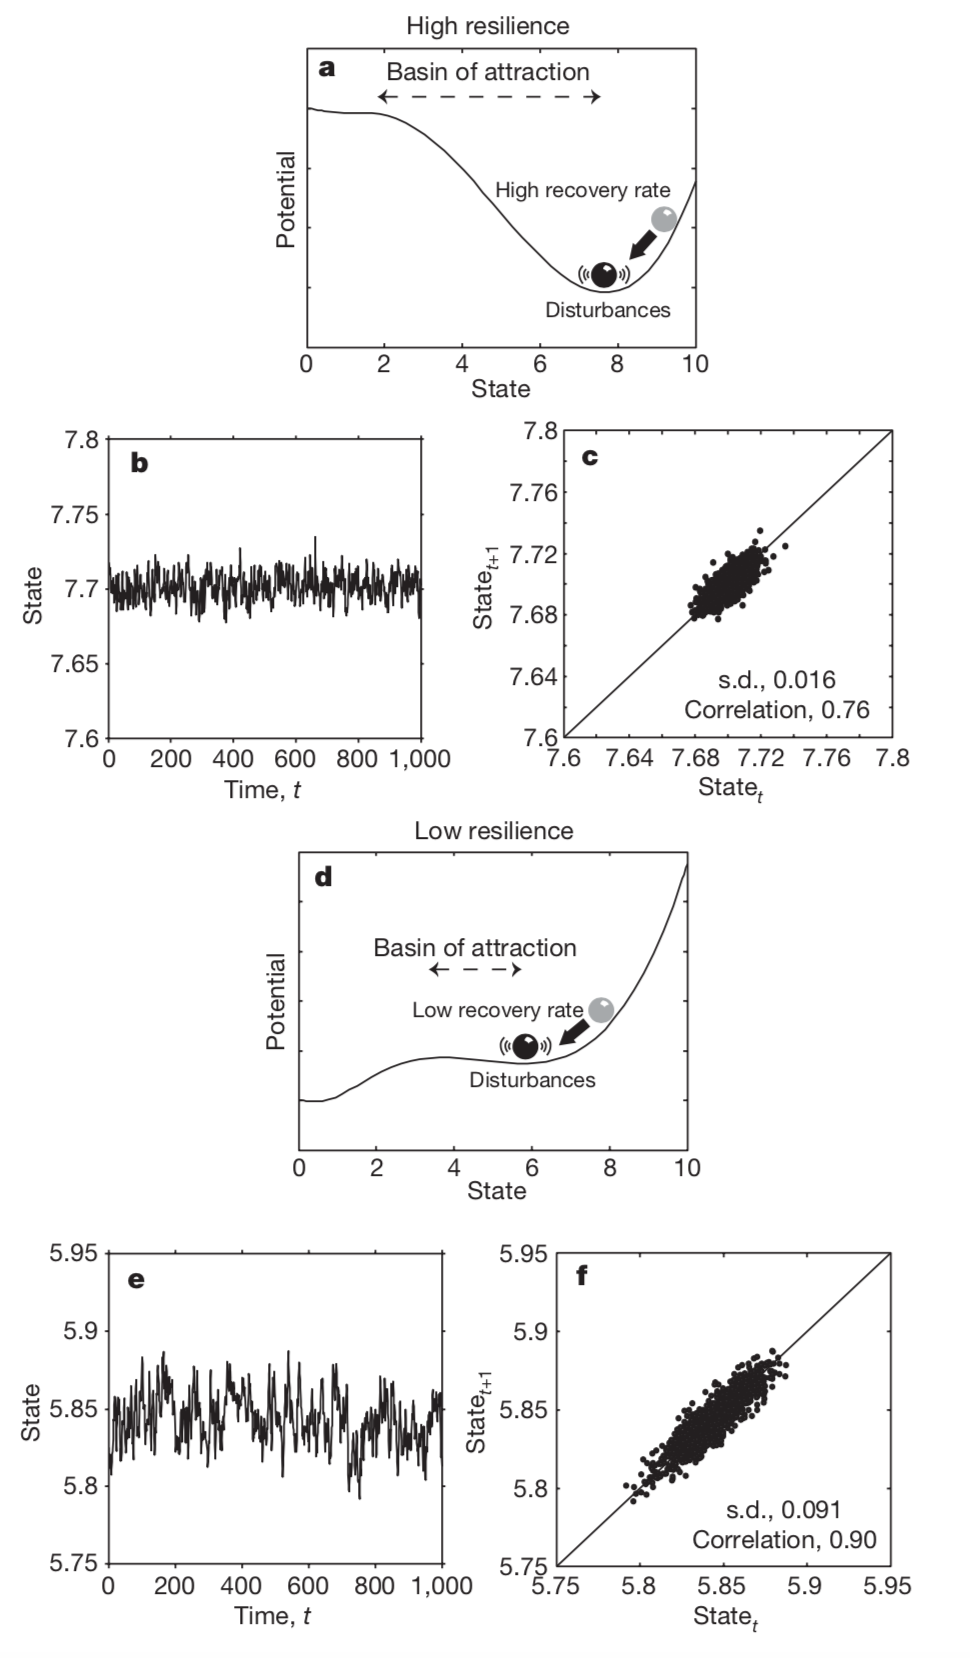
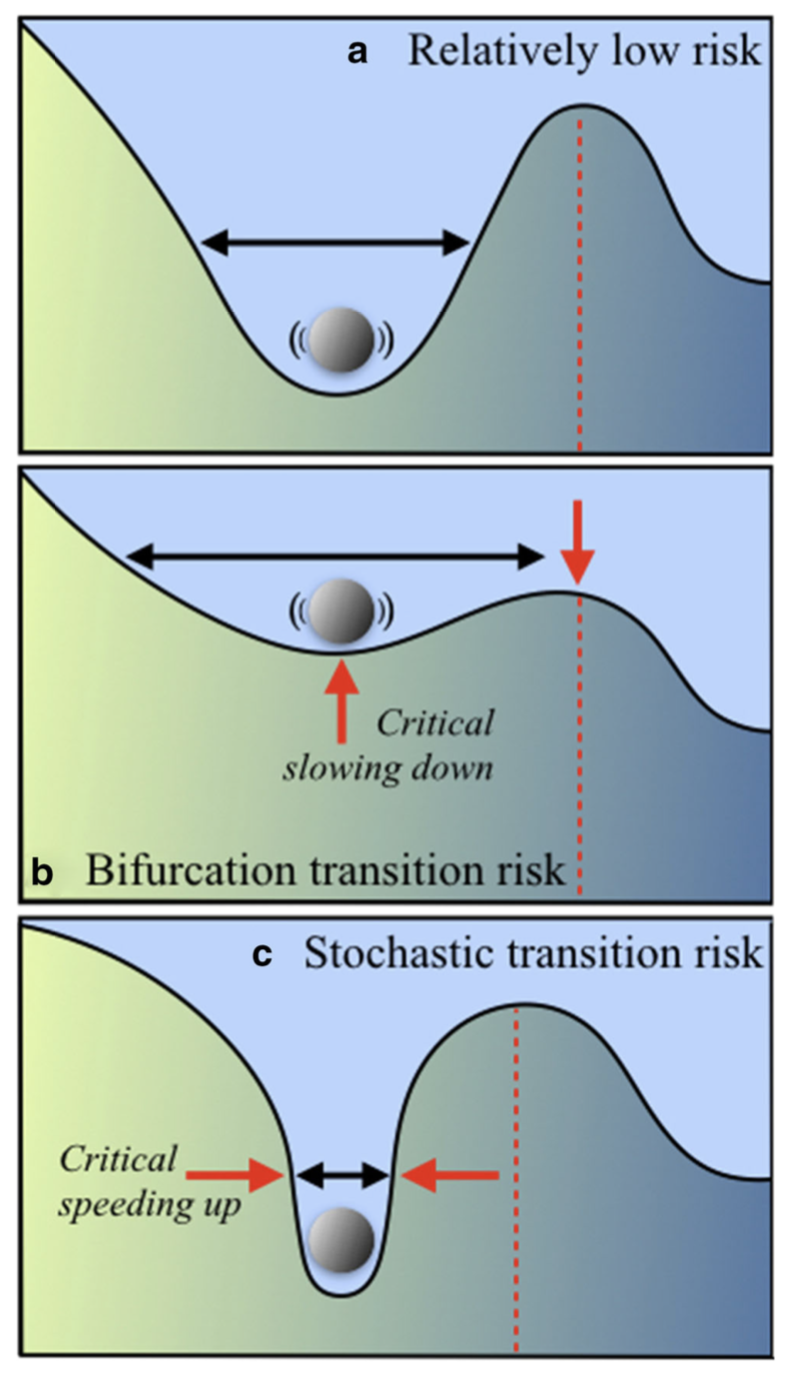
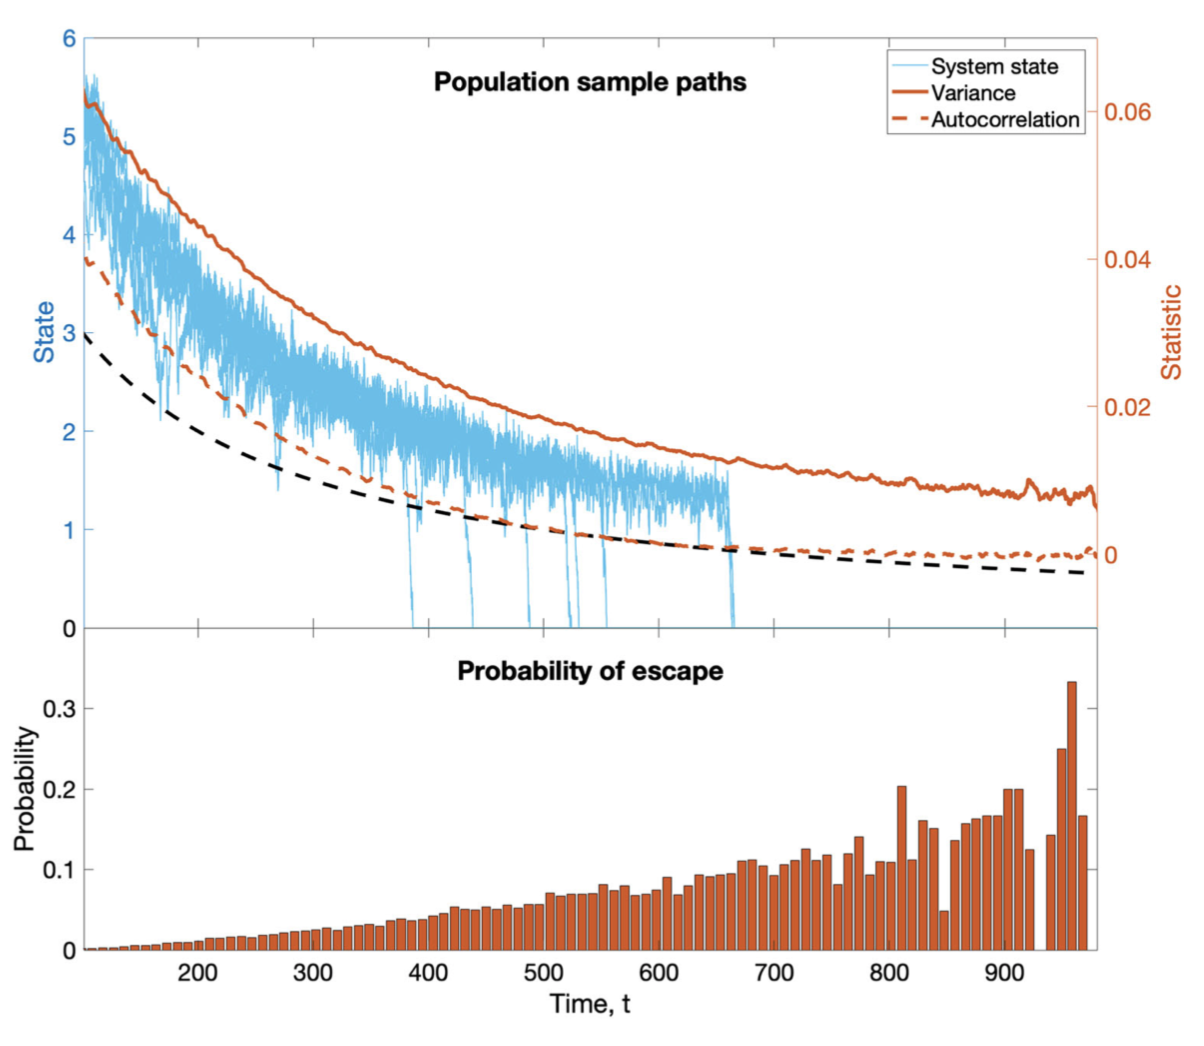
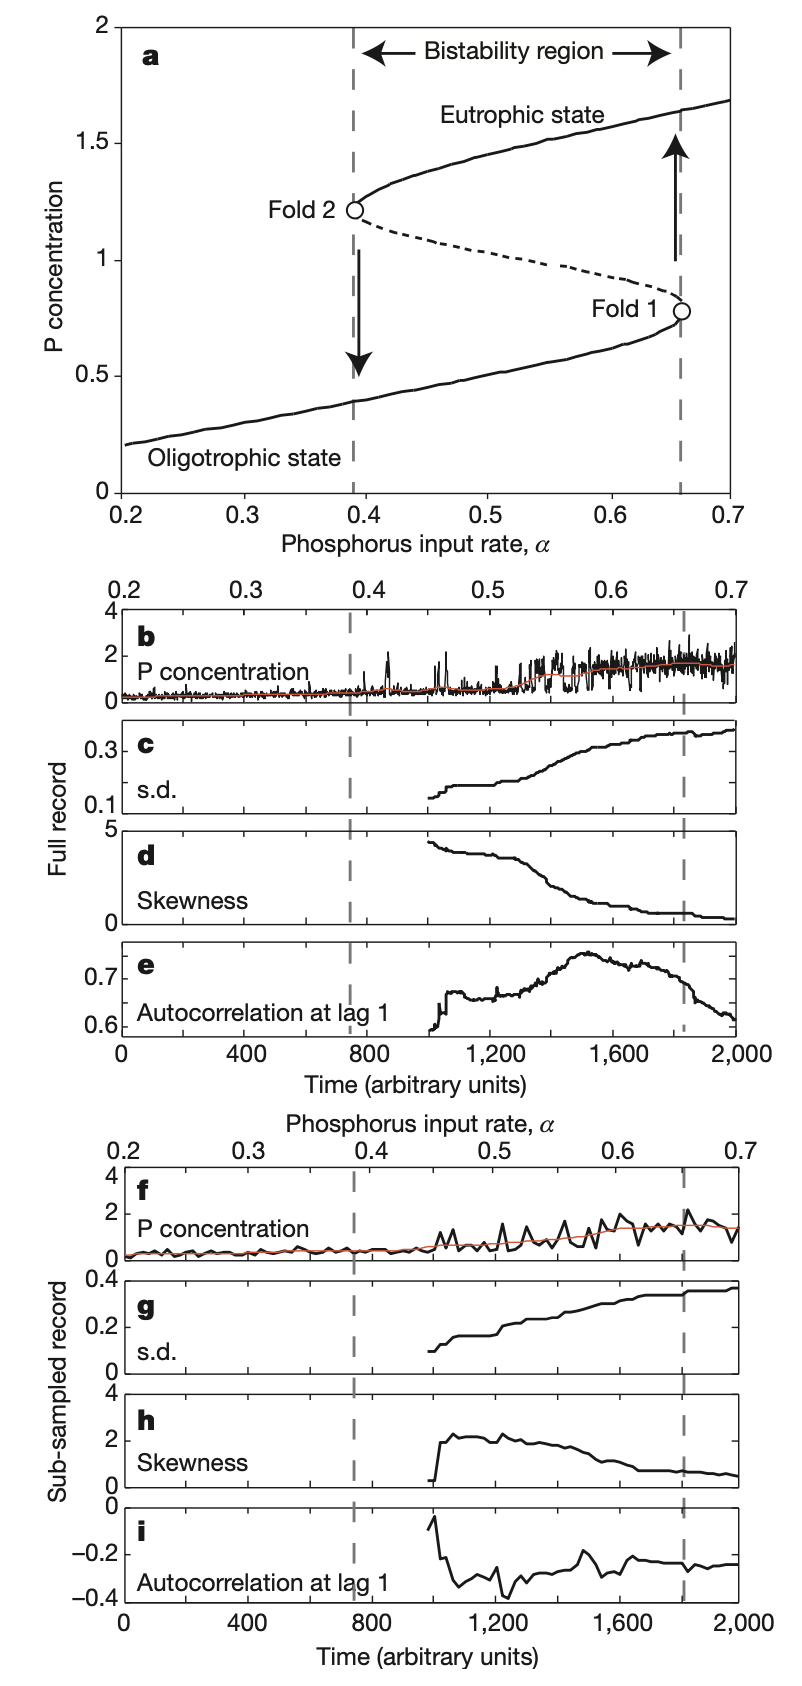
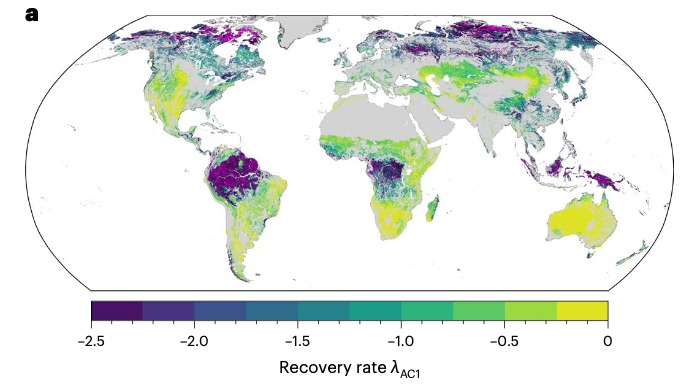
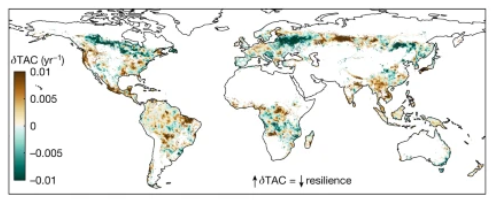
Critical slowing down
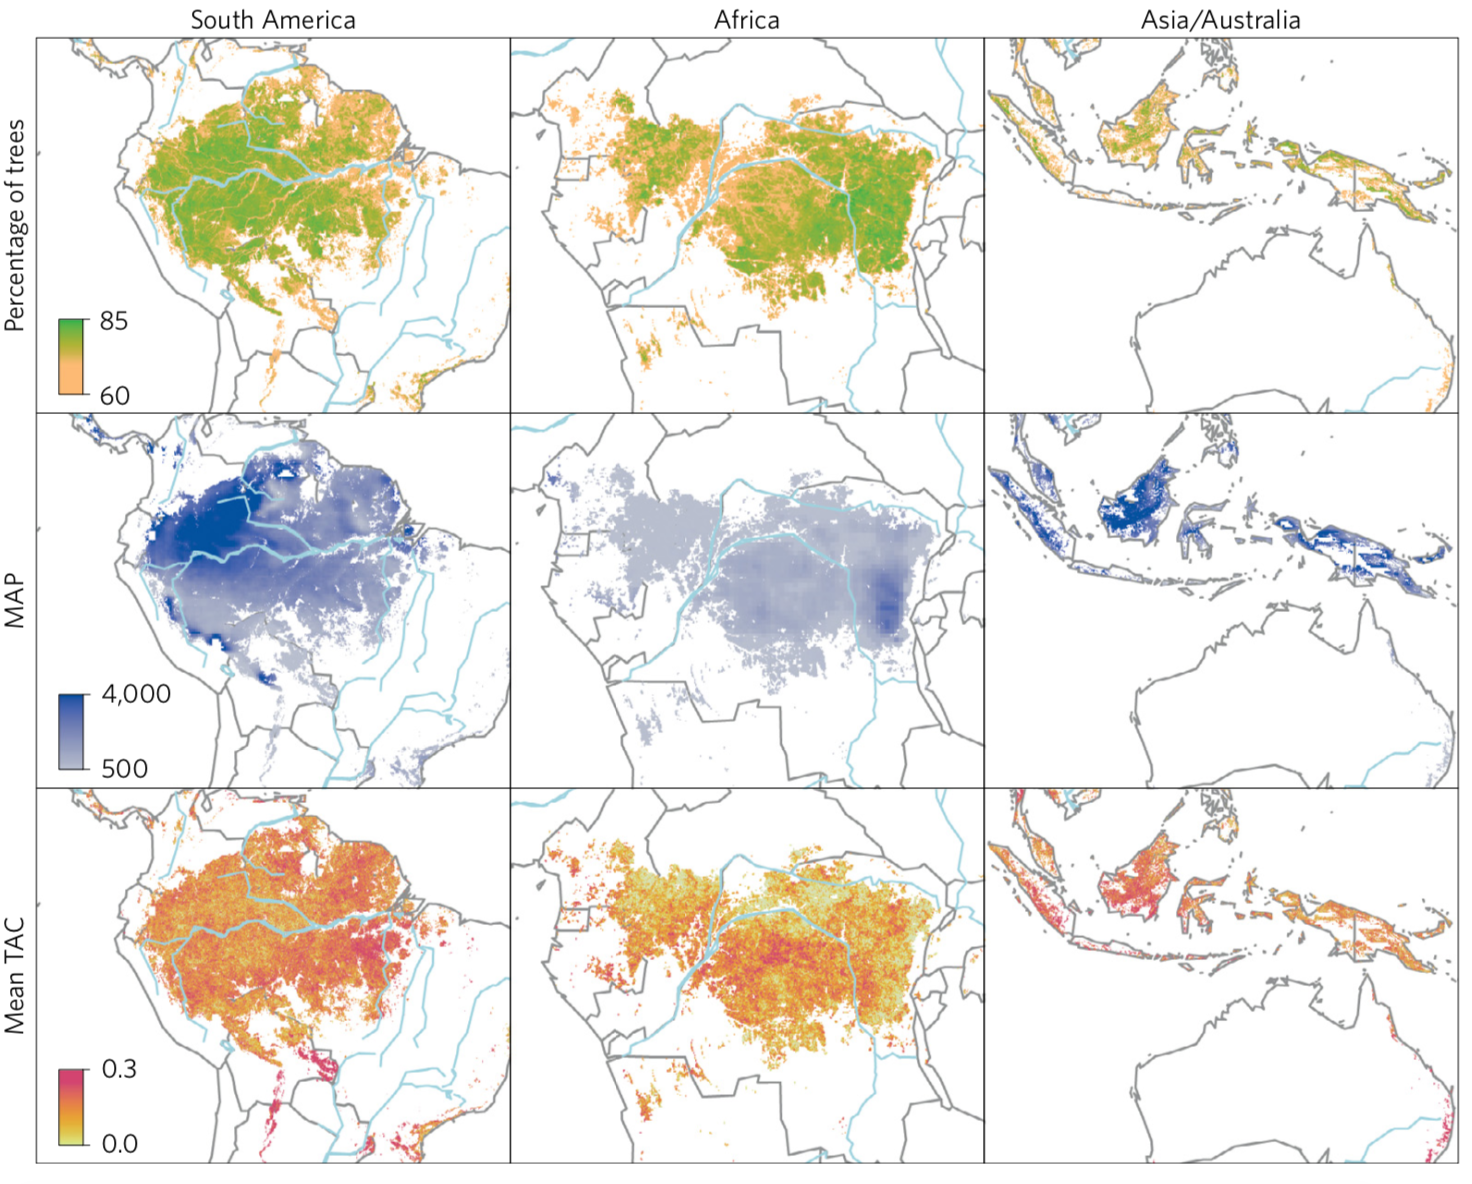
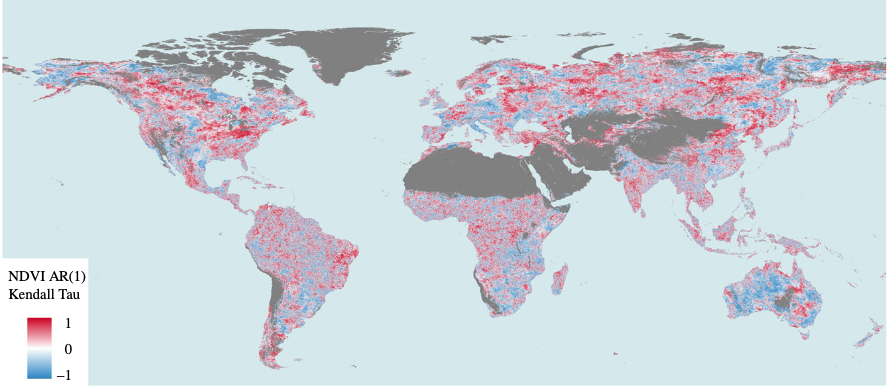
Verbesselt J, et al. Remotely sensed resilience of tropical forests. 2016.
- \(\uparrow\) Variance and autocorrelation
- NDVI: normalized difference vegetation index
- VOD: vegetation optical depth
- Limited spatial and temporal resolution
- Confirm a threshold: 1500mm
Limitations: fail when dynamics are driven by stochastic processes or when signals have too much noise
Critical speeding up
Flickering
- \(\Delta\) Skewness and Kurtosis
- System explore alternative states
- Biases the distribution towards new attractor
- Increase or decrease
- Only works on fast systems
Fractal dimension

- \(\uparrow\) adaptive capacity
- Measure of self-similarity across scales
- Fractal geometry:
- Bounded
- Magnitudes do not depend on scale
- Clear interpretation
- Applications in medicine
West, Bruce. 2010. Frontiers Physiology
Gneiting et al. 2012. Statistical Science.
Analysis: one pixel
![]()
The generic resilience indicators do not necessarily align with critical slowing down or speeding up theories: higher co-dimensions (multiple drivers).
Detection
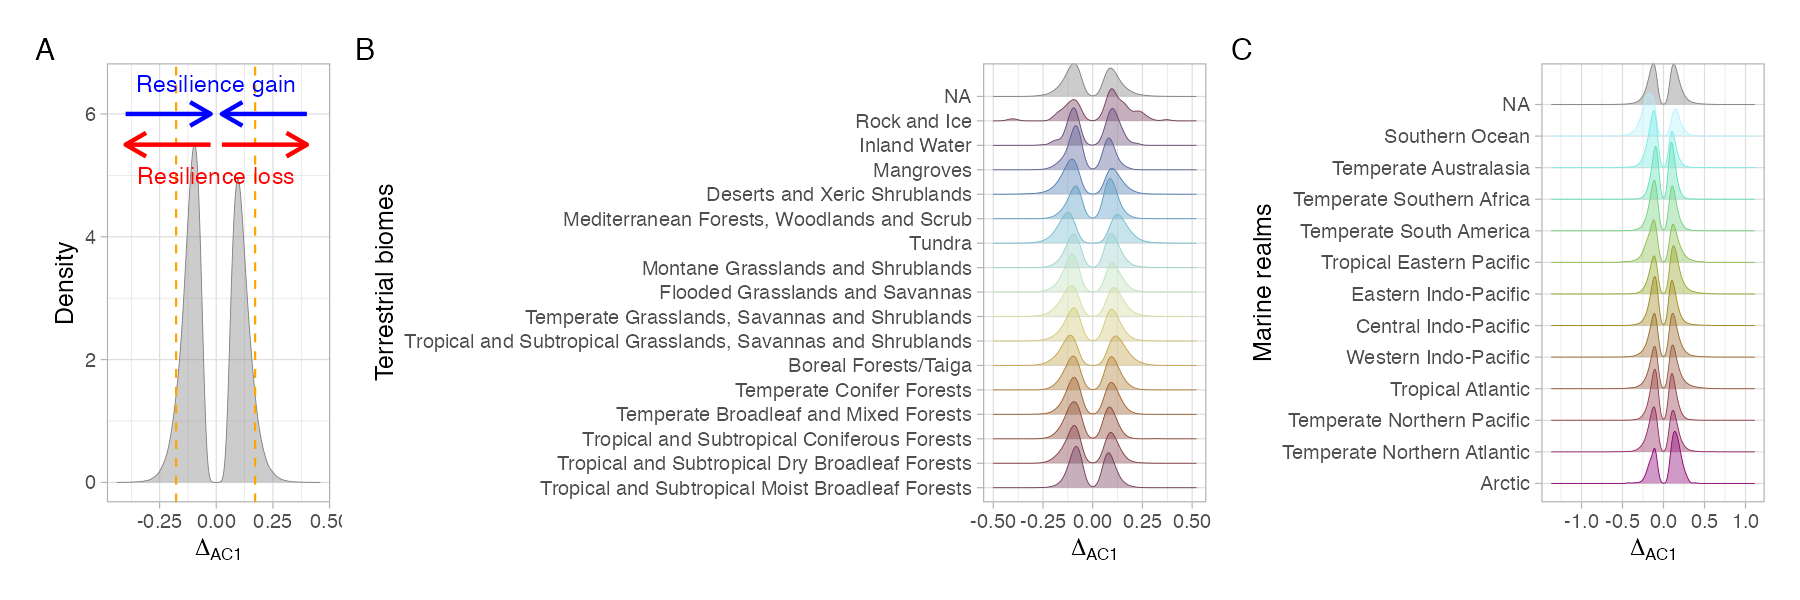
In the absence of ground truth, if \(\Delta\) is > 95% or < 5% of the distribution is considered a signal of resilience loss
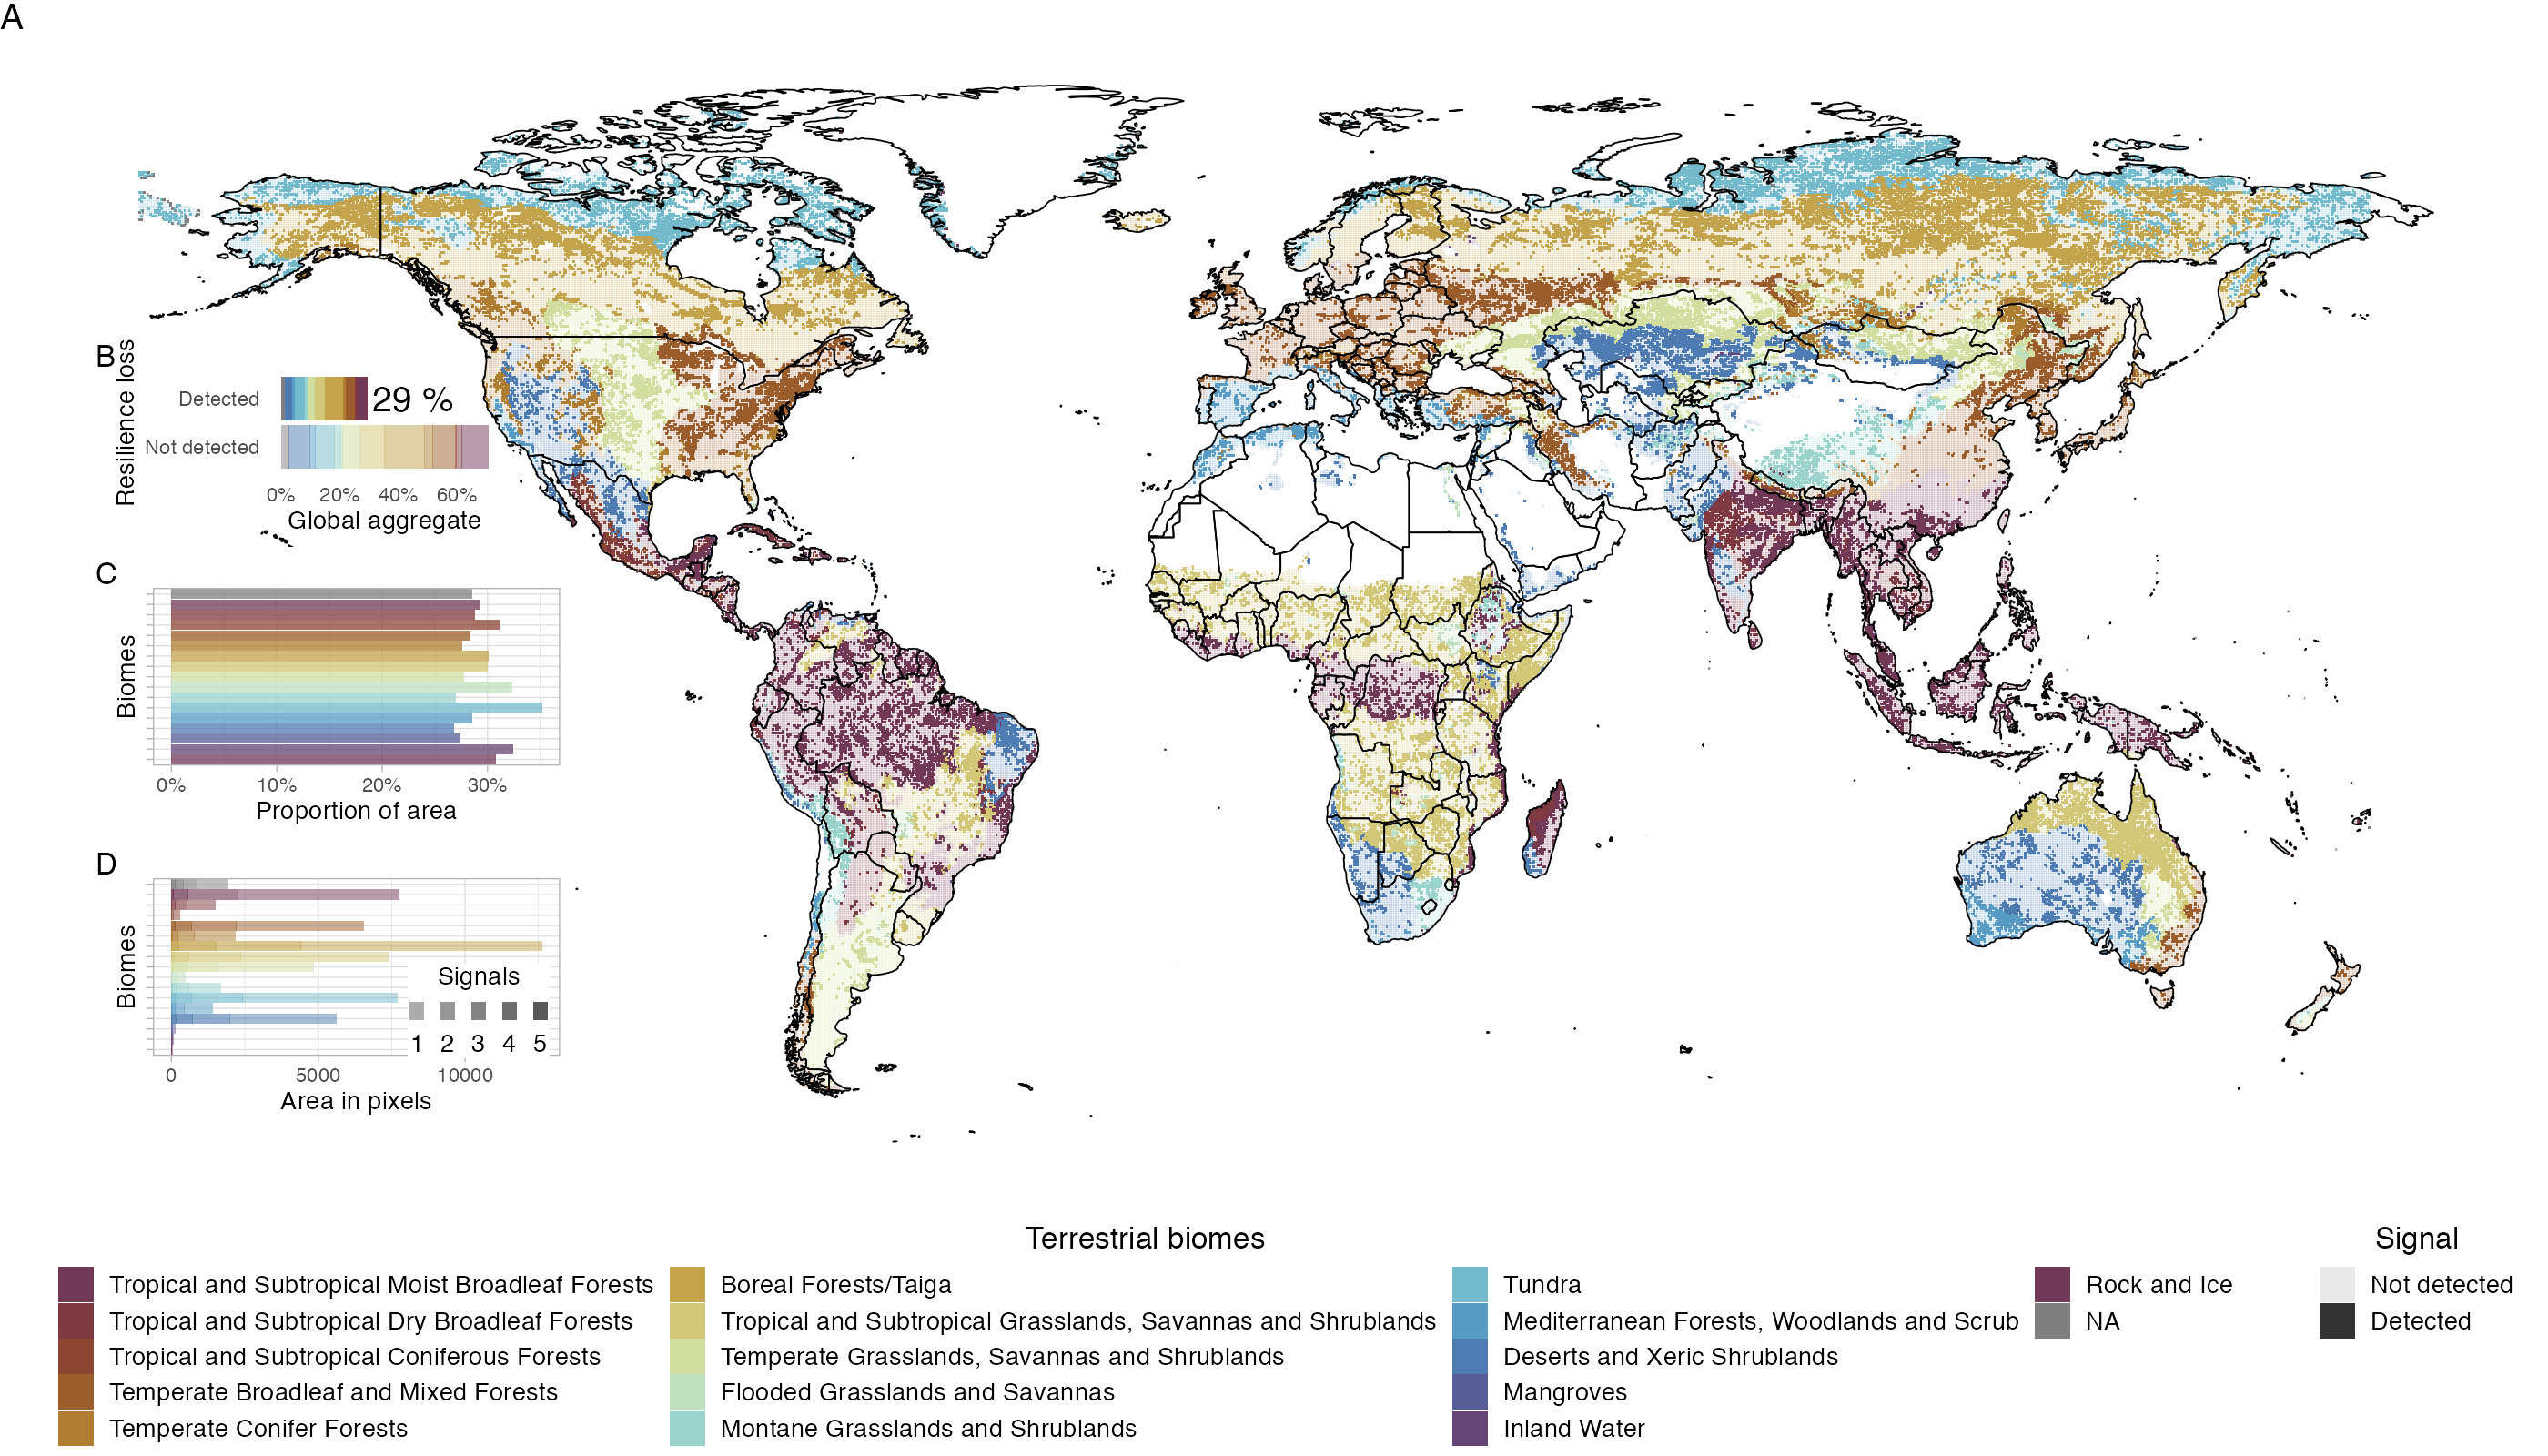
~30% of ecosystem show symptoms of resilience loss, boreal forest and tundra particularly strong signals
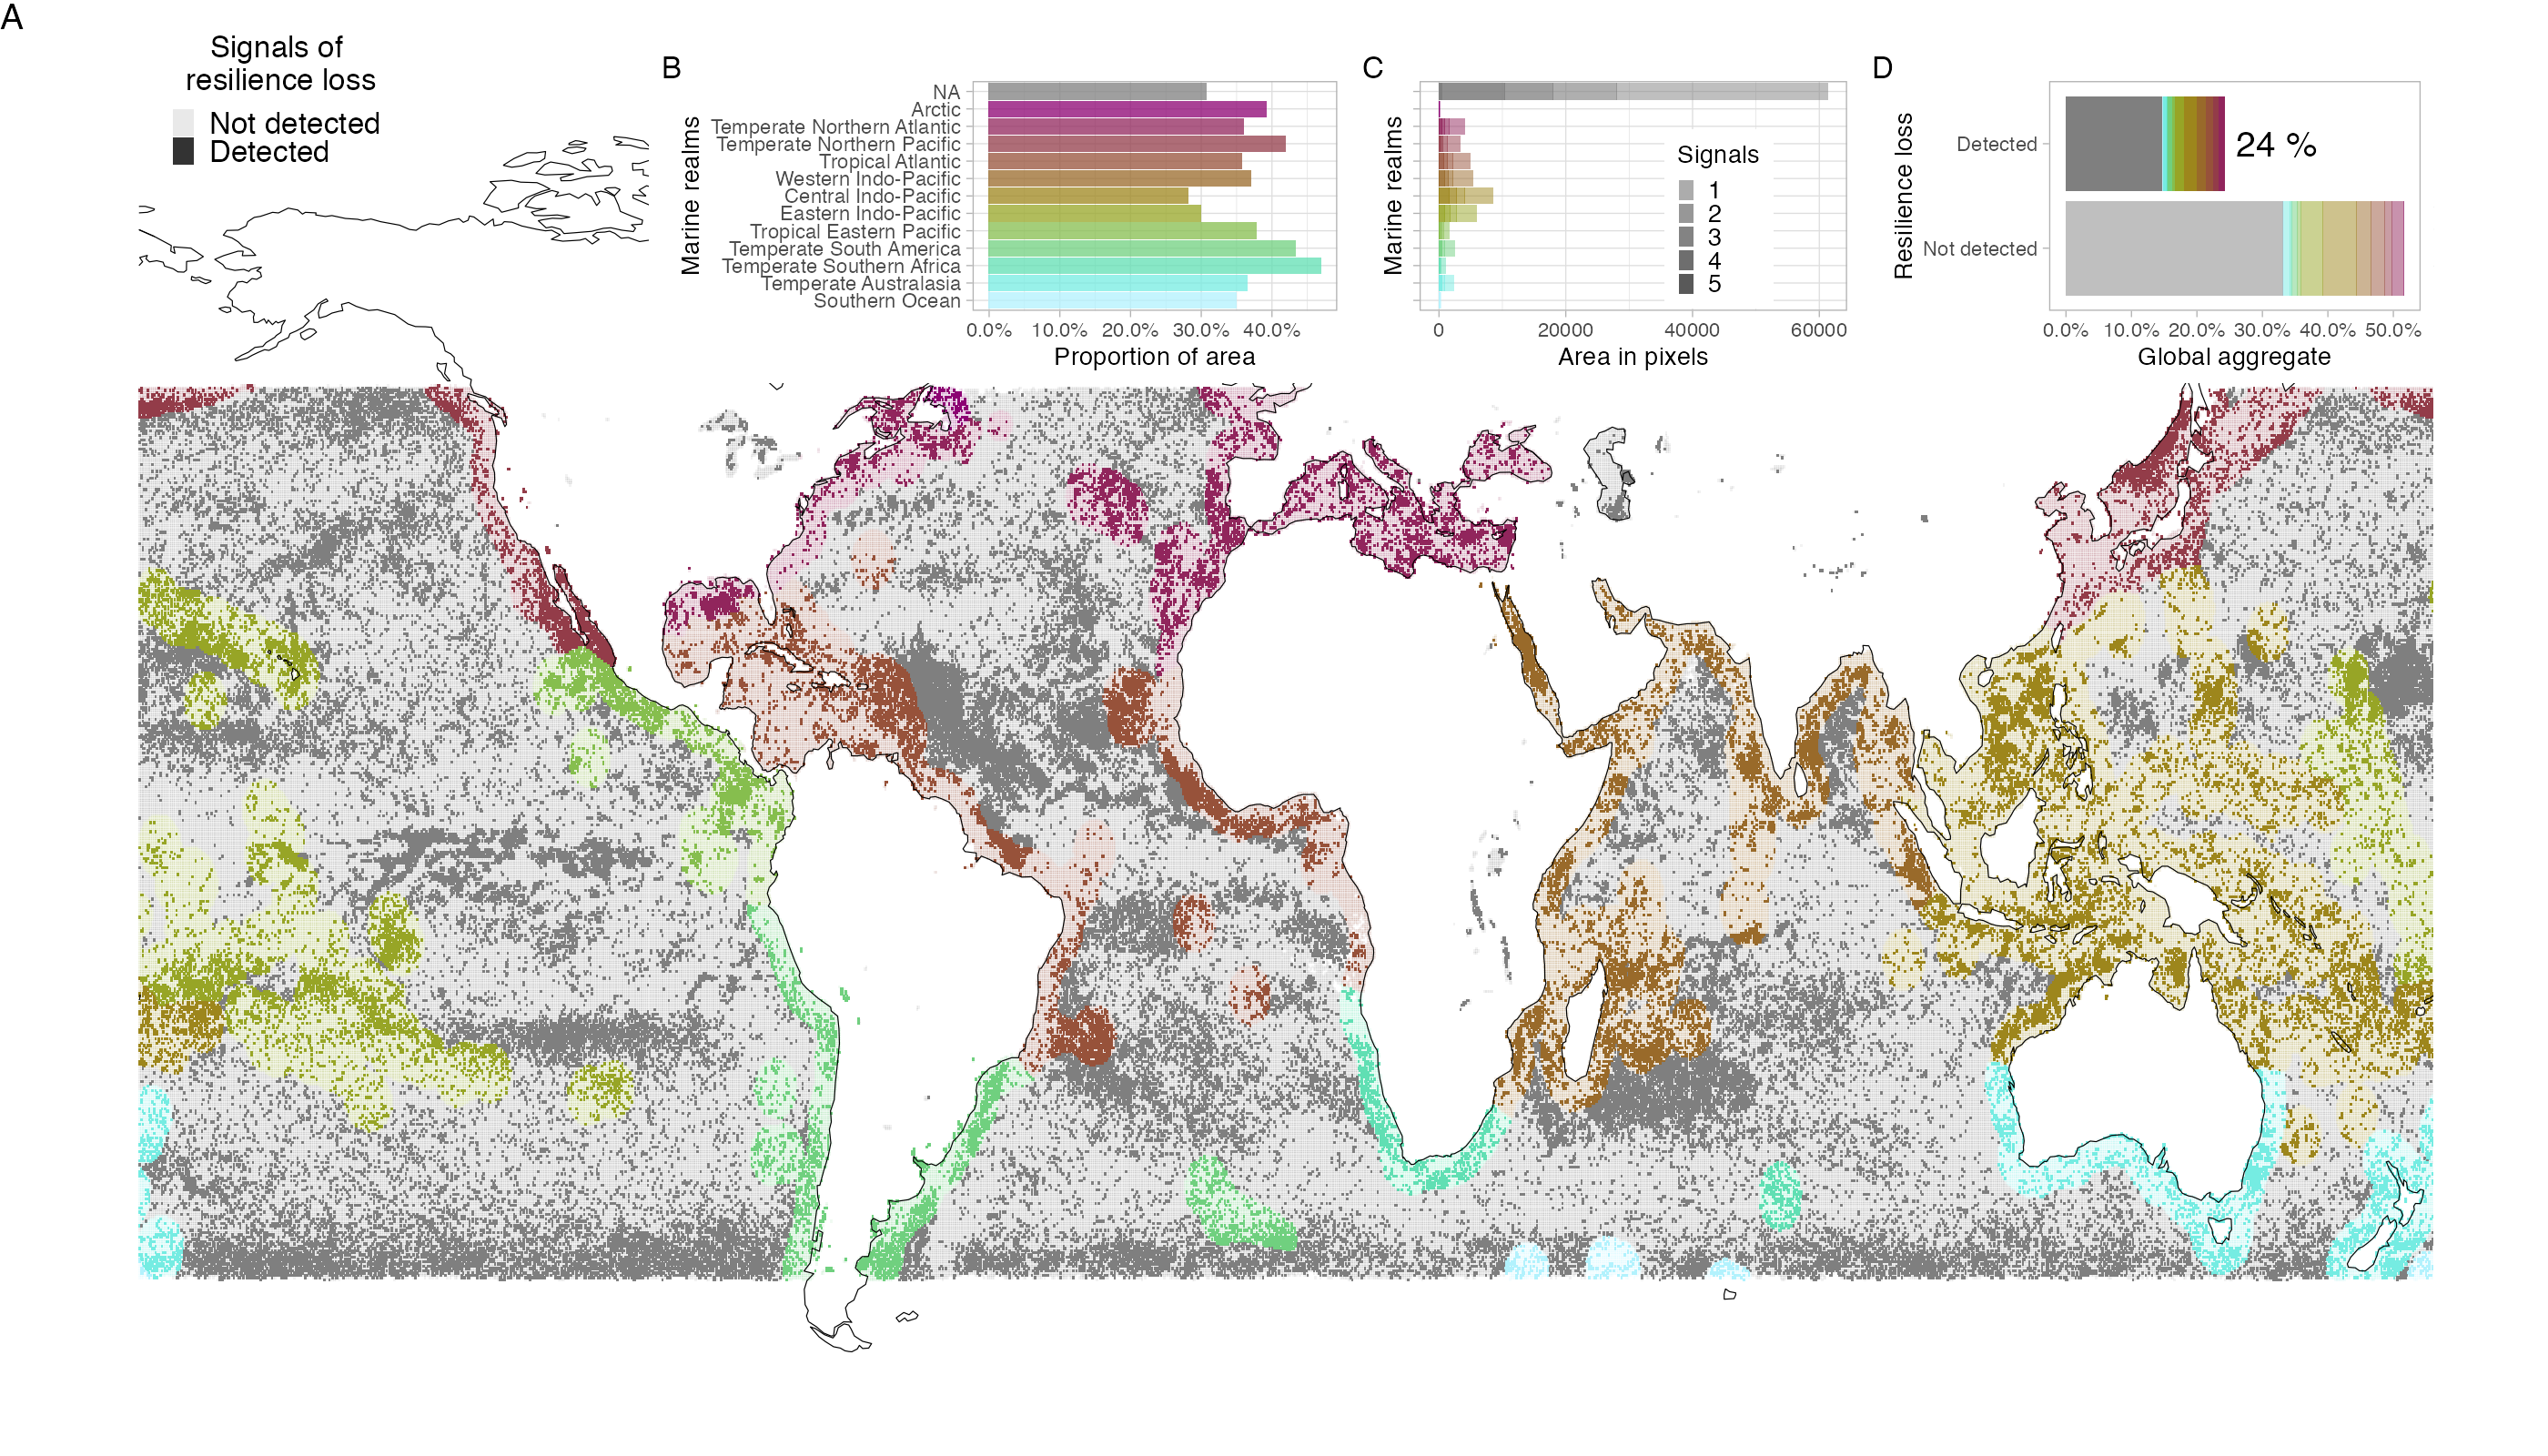
~25% of ecosystem show symptoms of resilience loss, Easter Indo-Pacific and Tropical Eastern Pacific Oceans particularly strong signals
Others: little agreement and no ground truth

Attempts to validate: triangulation
Permutation test 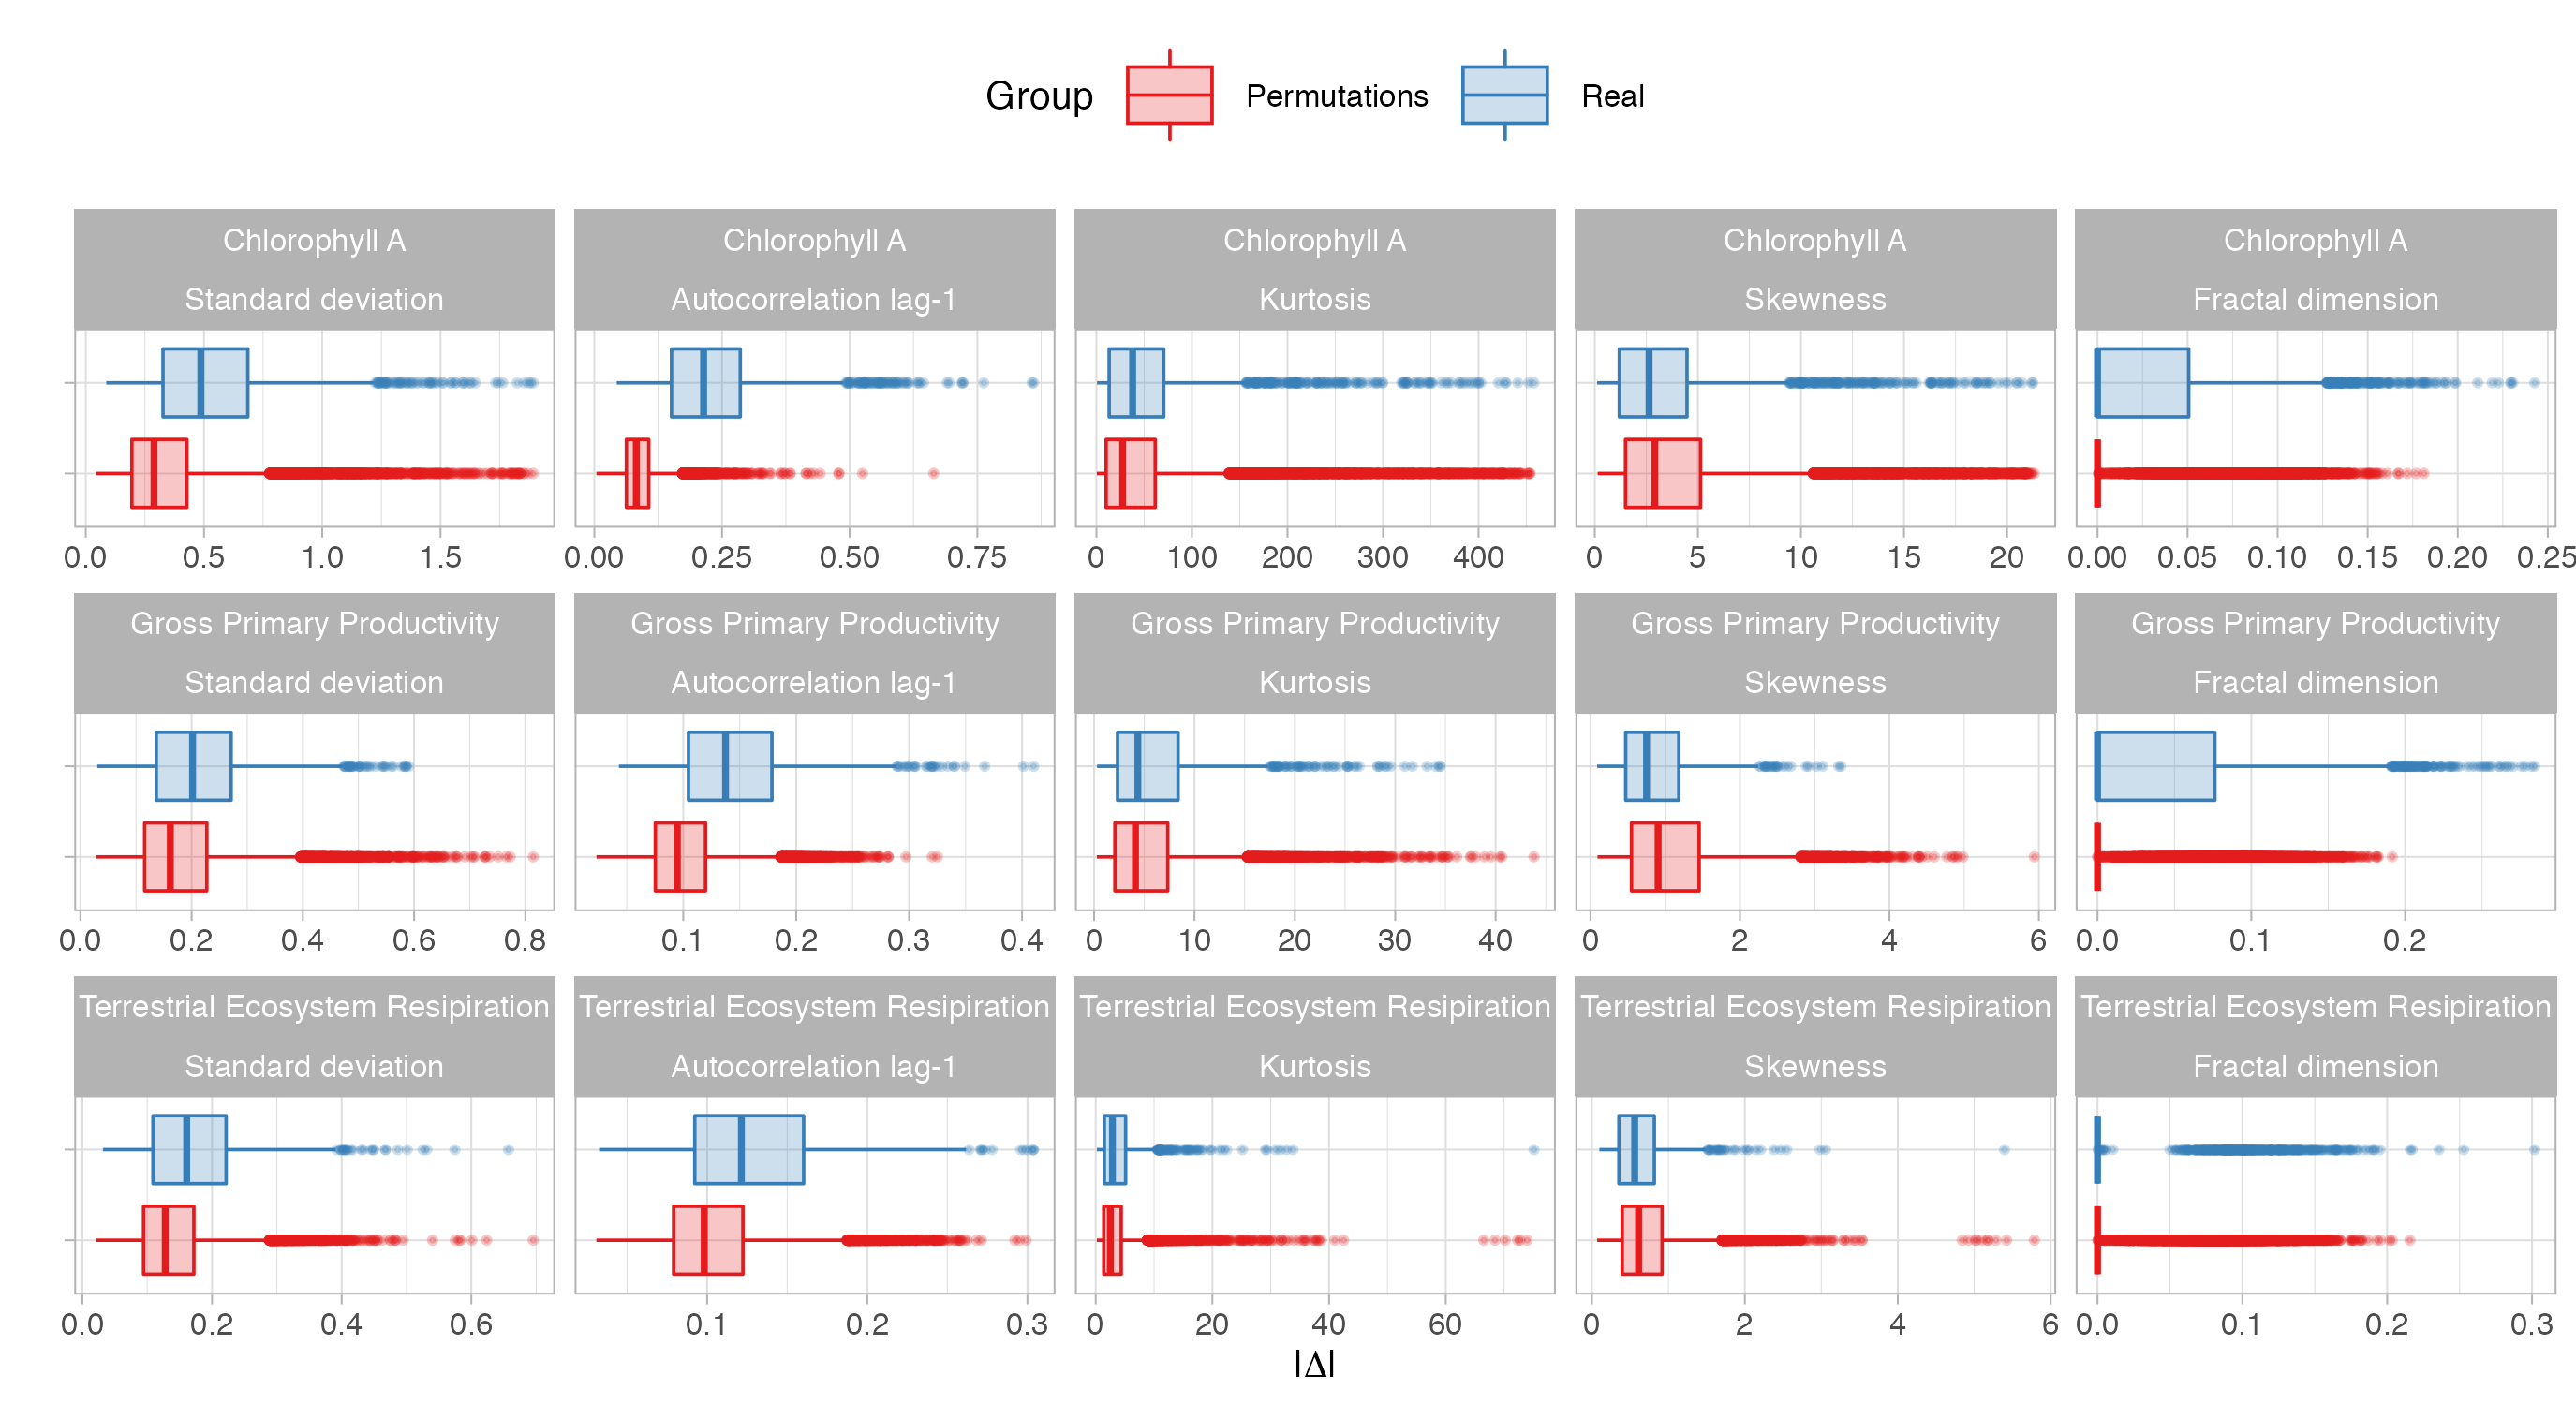
Compare with alternative methods 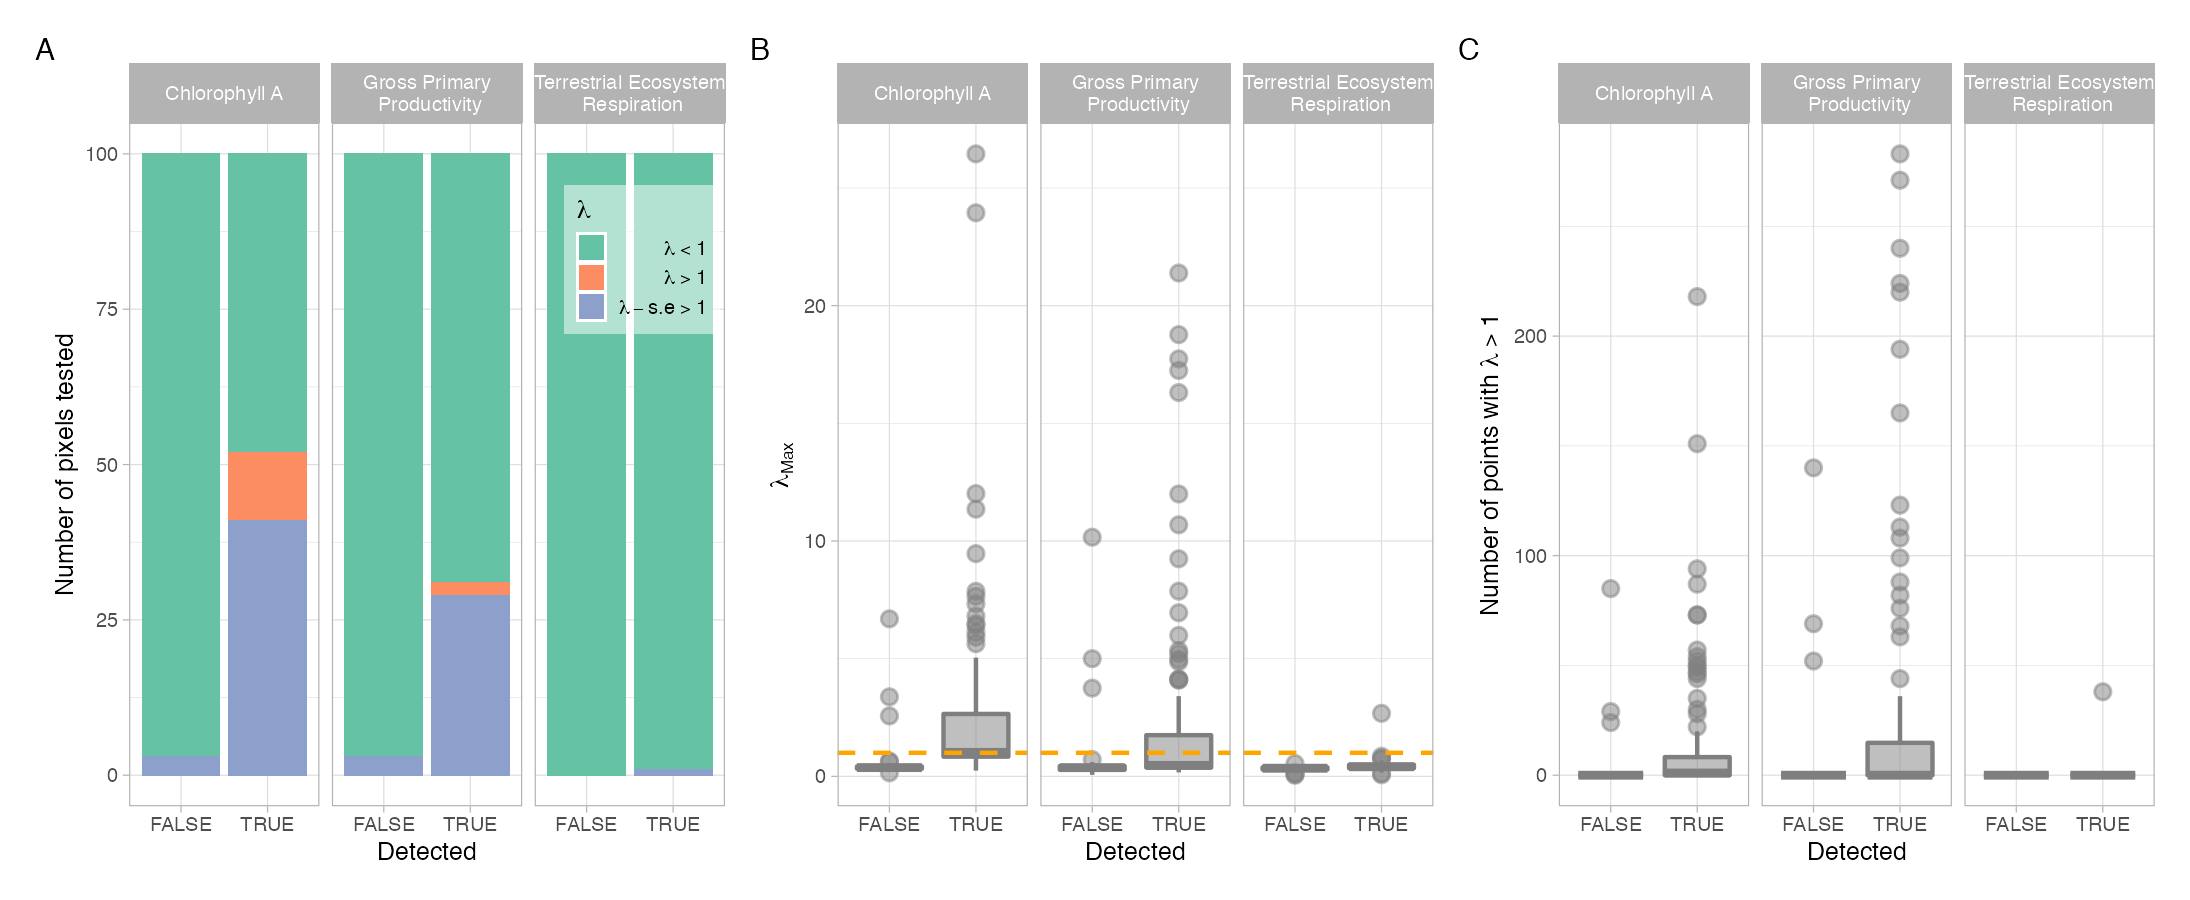
XAI methods to explore detection of EWS:
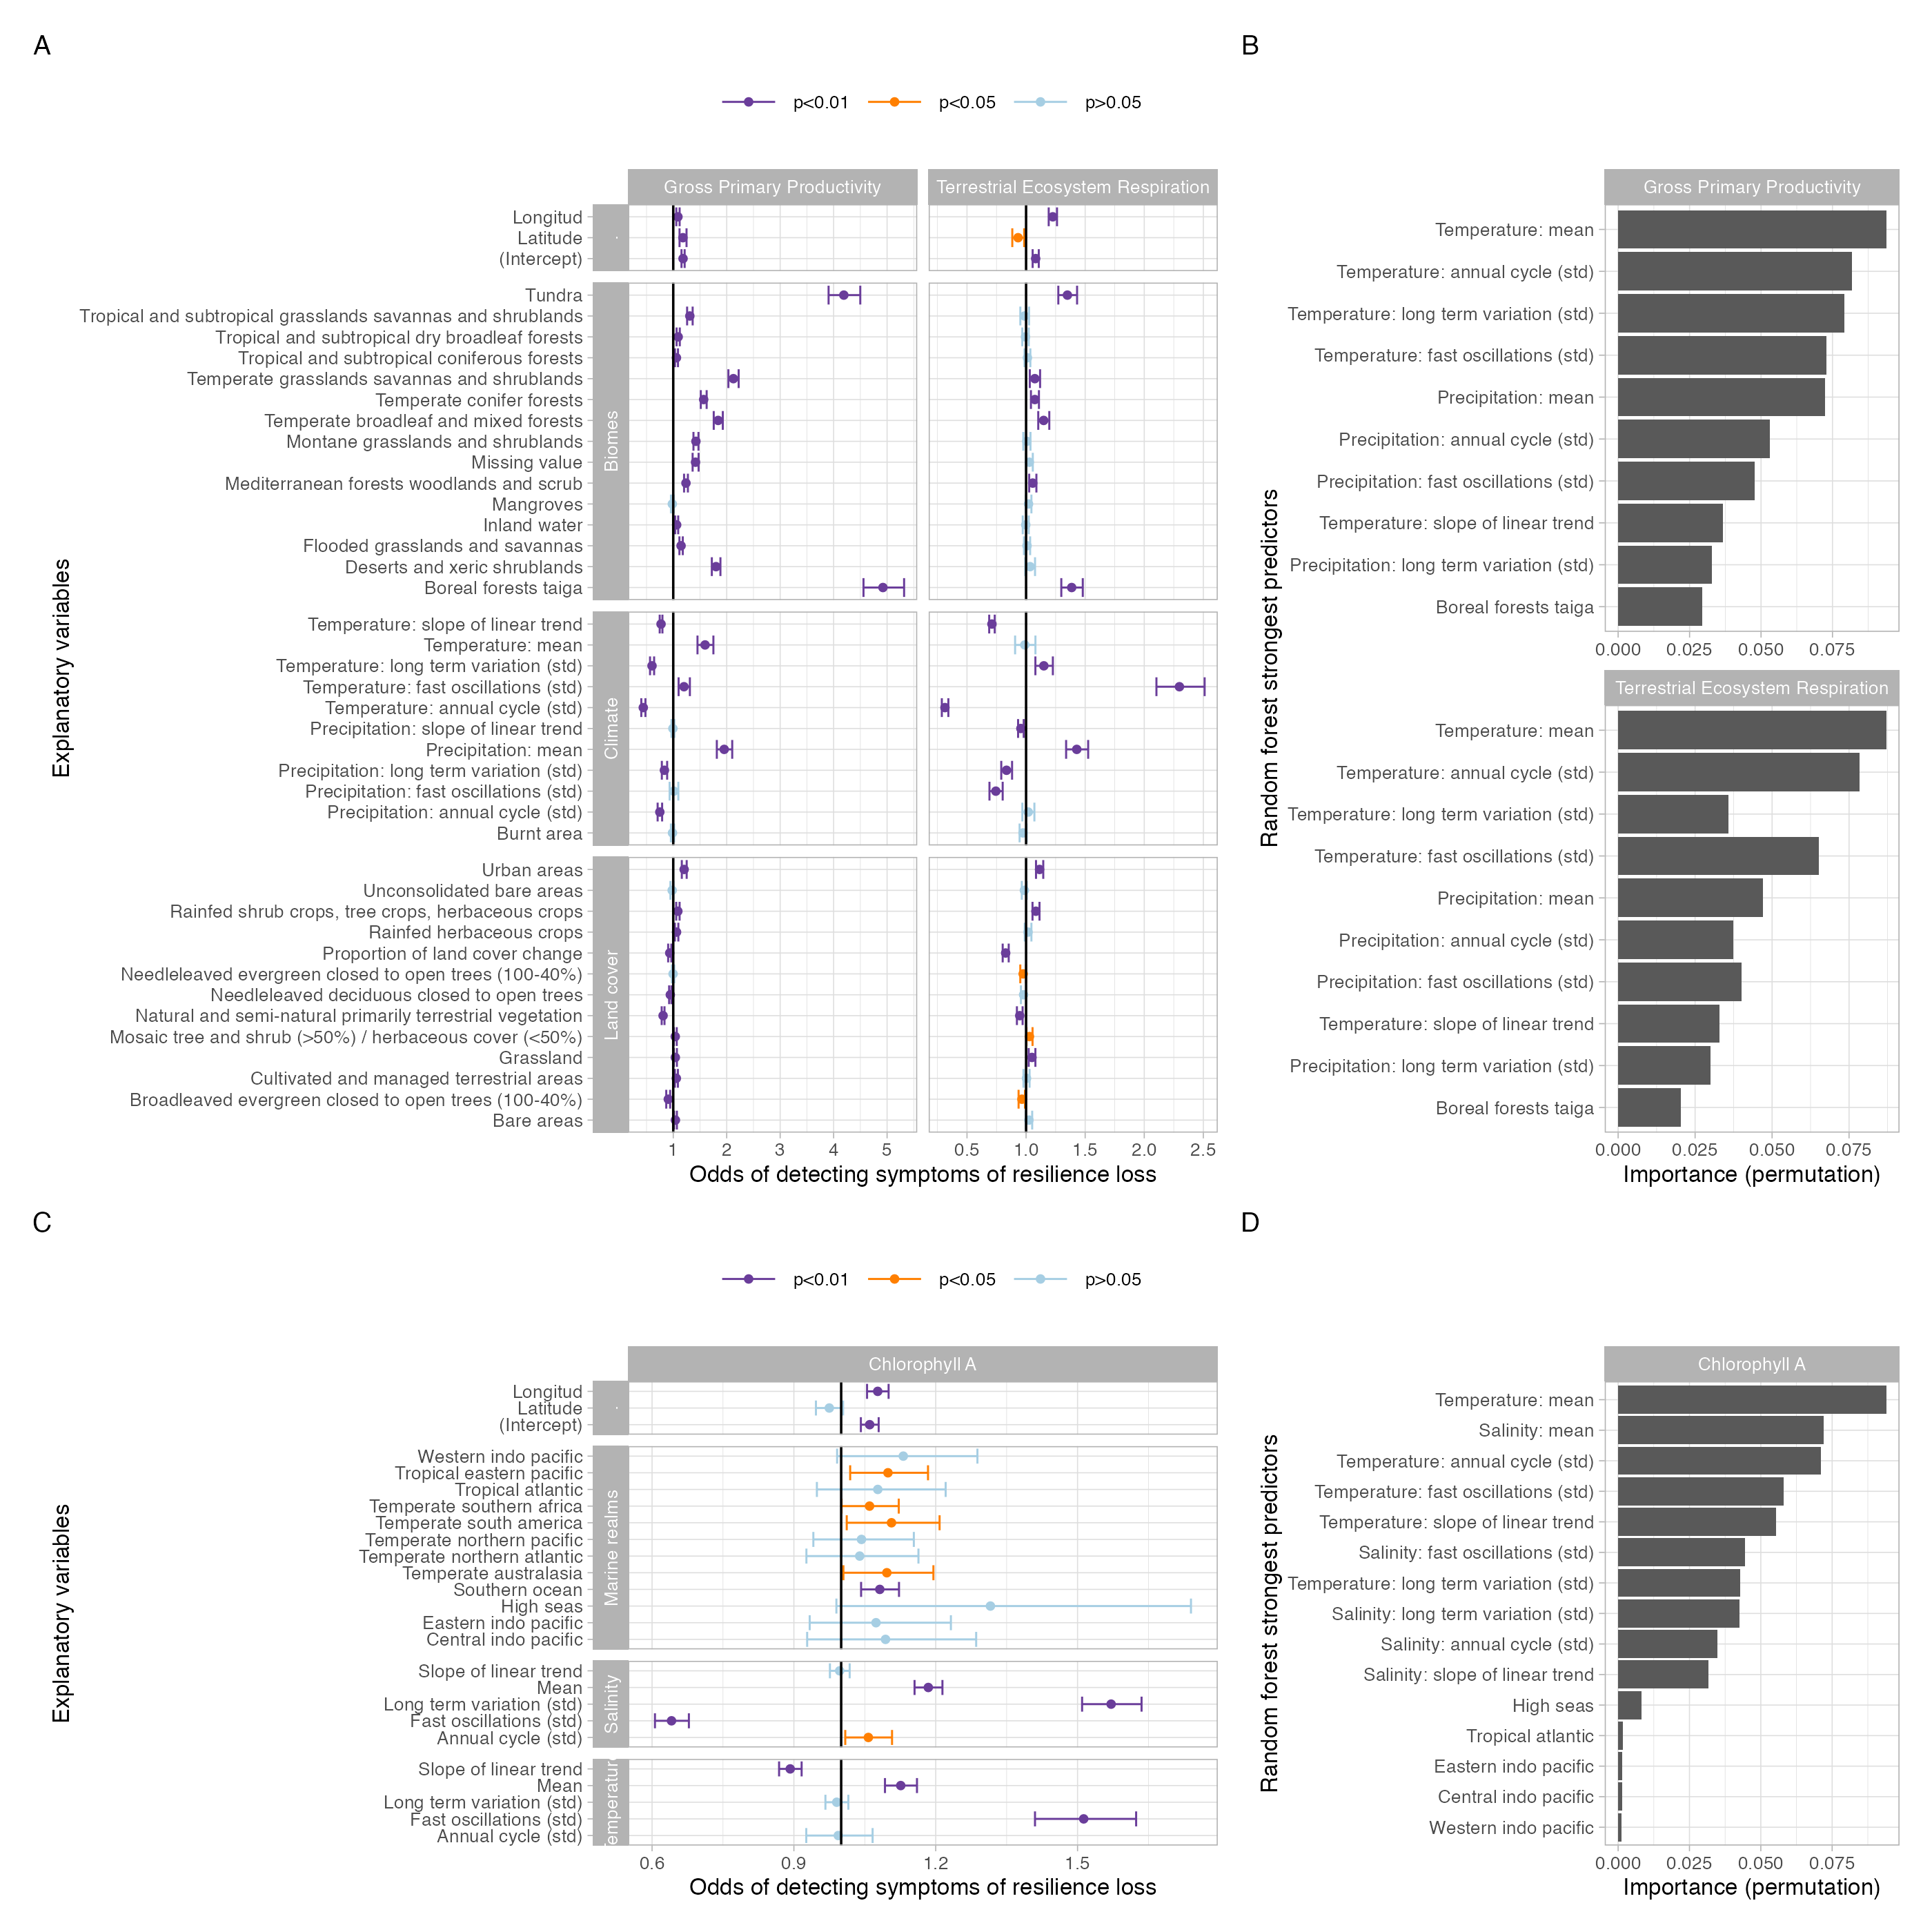
- If CSD was the main route to tipping, only one driver should be of high predicting value and it should be the slope of the linear trend
- Multiple factors, and multiple scales of influence are at play
- Experiments showed that under higher co-dims, increase/decrease in Var and AC1 can be expected
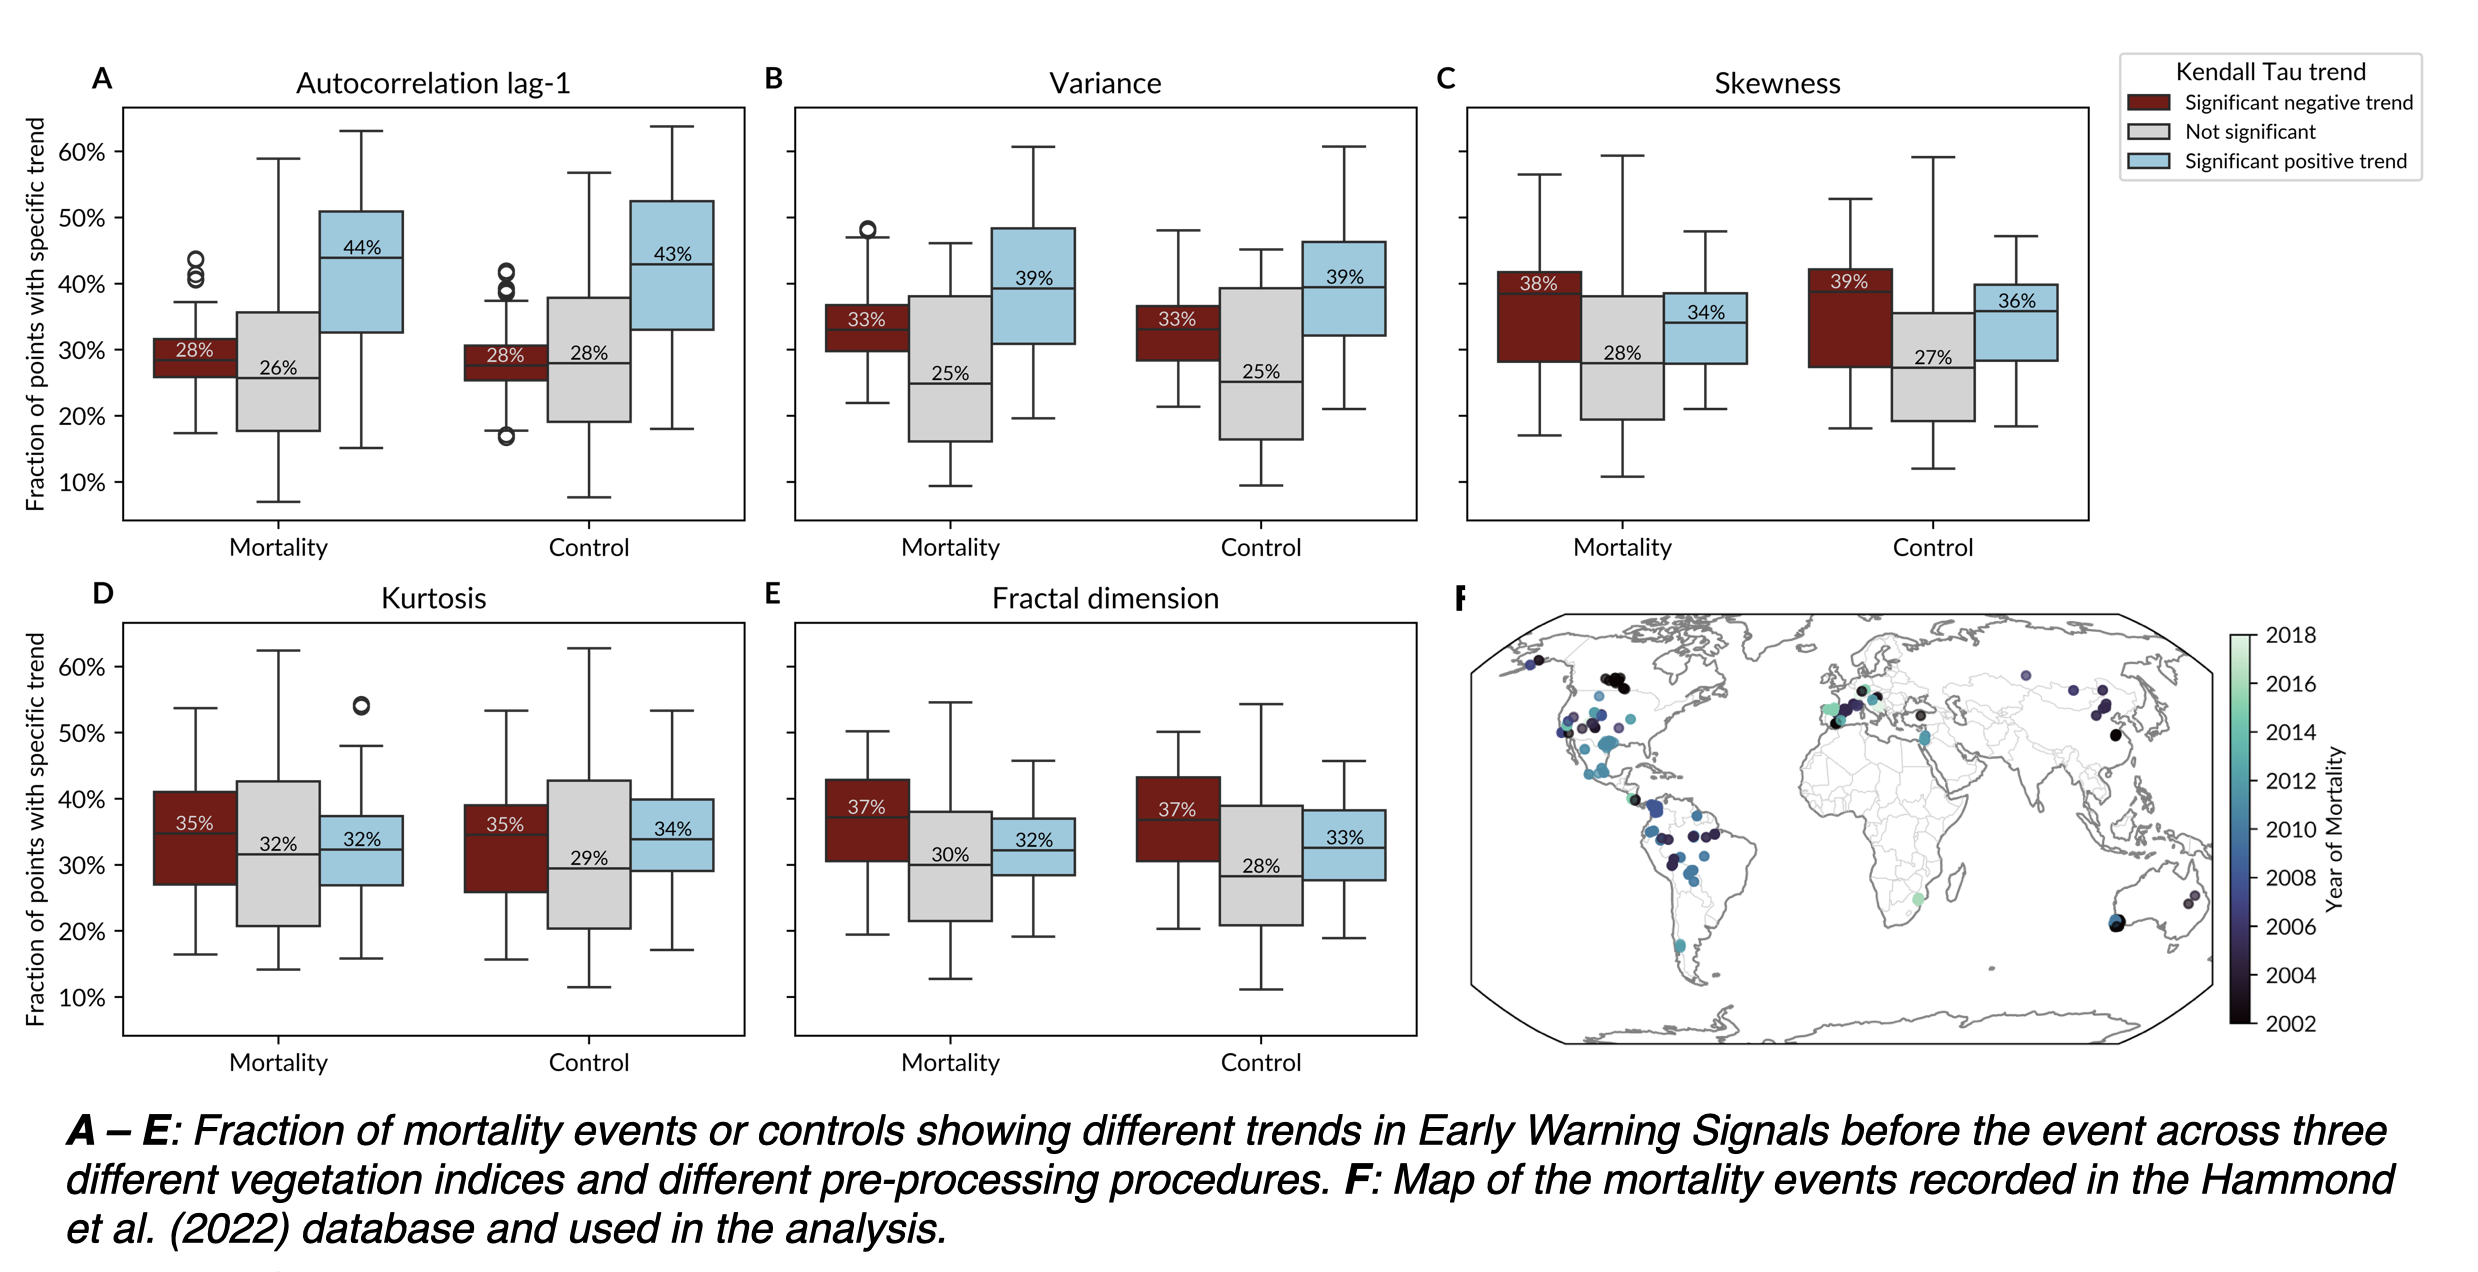
Early warning signals don’t predict forest die-offs

Resilience of the water cycle: Single metrics are not enough

Lessons
- Measuring resilience from data is an open problem
[B-tipping, N-tipping, R-tipping] - Benefit from ML and XAI approaches to quantify accuracy and uncertainty
- But it needs to be trained on observations, not synthetic models
- Open invitation to explore collaborations
Reach out: juan.rocha@su.se