- Structure of simple functions
- Advanced functions for iteration
if,ifelse,for,whileapply()and its family (tapply,lapply,sapply,mapply)
- Homework
- Exercises
Functions in R
Juan C. Rocha
Stockholm Resilience Centre, Stockholm University
![]()
Previously
Exercise
- Open an RStudio session https://github.com/ifetzer/RStudioForTeaching
- Load the
gapminderdata countryis of the classfactor, discuss in couples what are they and when are useful?- Tip:
help(factor)&help(levels)
- Tip:
- How many countries has the
gapminderdata? - Write a function to calculate the average
- Test it in small cases
- For every country in the dataset calculate the average life expectancy, the range of the popluation, and the median GDP per capita
- Tip:
for(),median(),range()
- Tip:
- Use the result to plot:
- Average
lifeExpvs mediangdpPercap
- Average
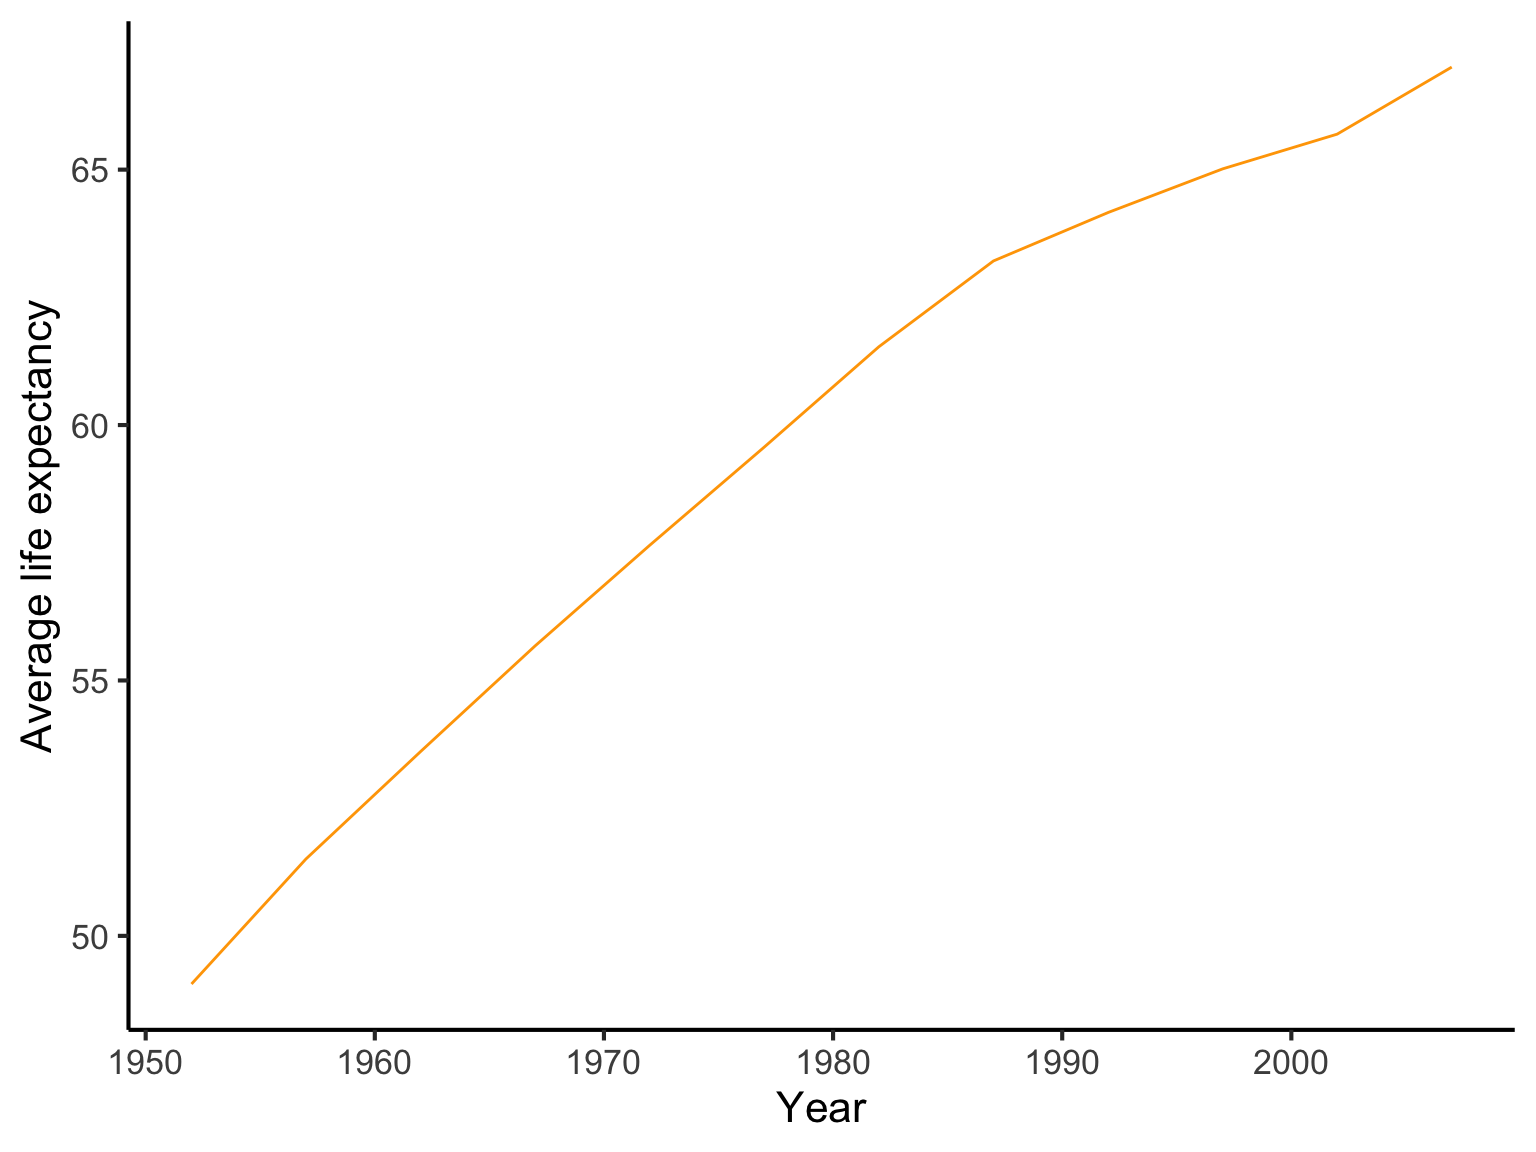
- For every year in the dataset calculate the average life expectancy across all countries. Plot the result over time
??base::plot
Solutions
- How many countries has the
gapminderdata?
[1] "factor"[1] 142Solutions
- For every country in the dataset calculate the average life expectancy, the range of the population, and the median GDP per capita
base
countries <- levels(gapminder$country)
# when working with loops, it is a good practice to
# declare the objects that will collect your results
ale <- list() # average life expectancy
pop_rng <- list() # population range
med_gdp <- list() # median gdp

for (i in seq_along(countries)) {
    ale[[i]] <- avg(
        gapminder[gapminder$country == countries[i], "lifeExp"])
    pop_rng[[i]] <- range(
        gapminder[gapminder$country == countries[i], "pop"])
    med_gdp[[i]] <- median(
        gapminder[gapminder$country == countries[i],]$gdpPercap, na.rm = TRUE)

}Solutions
- Use the result to plot: Average
lifeExpvs mediangdpPercap
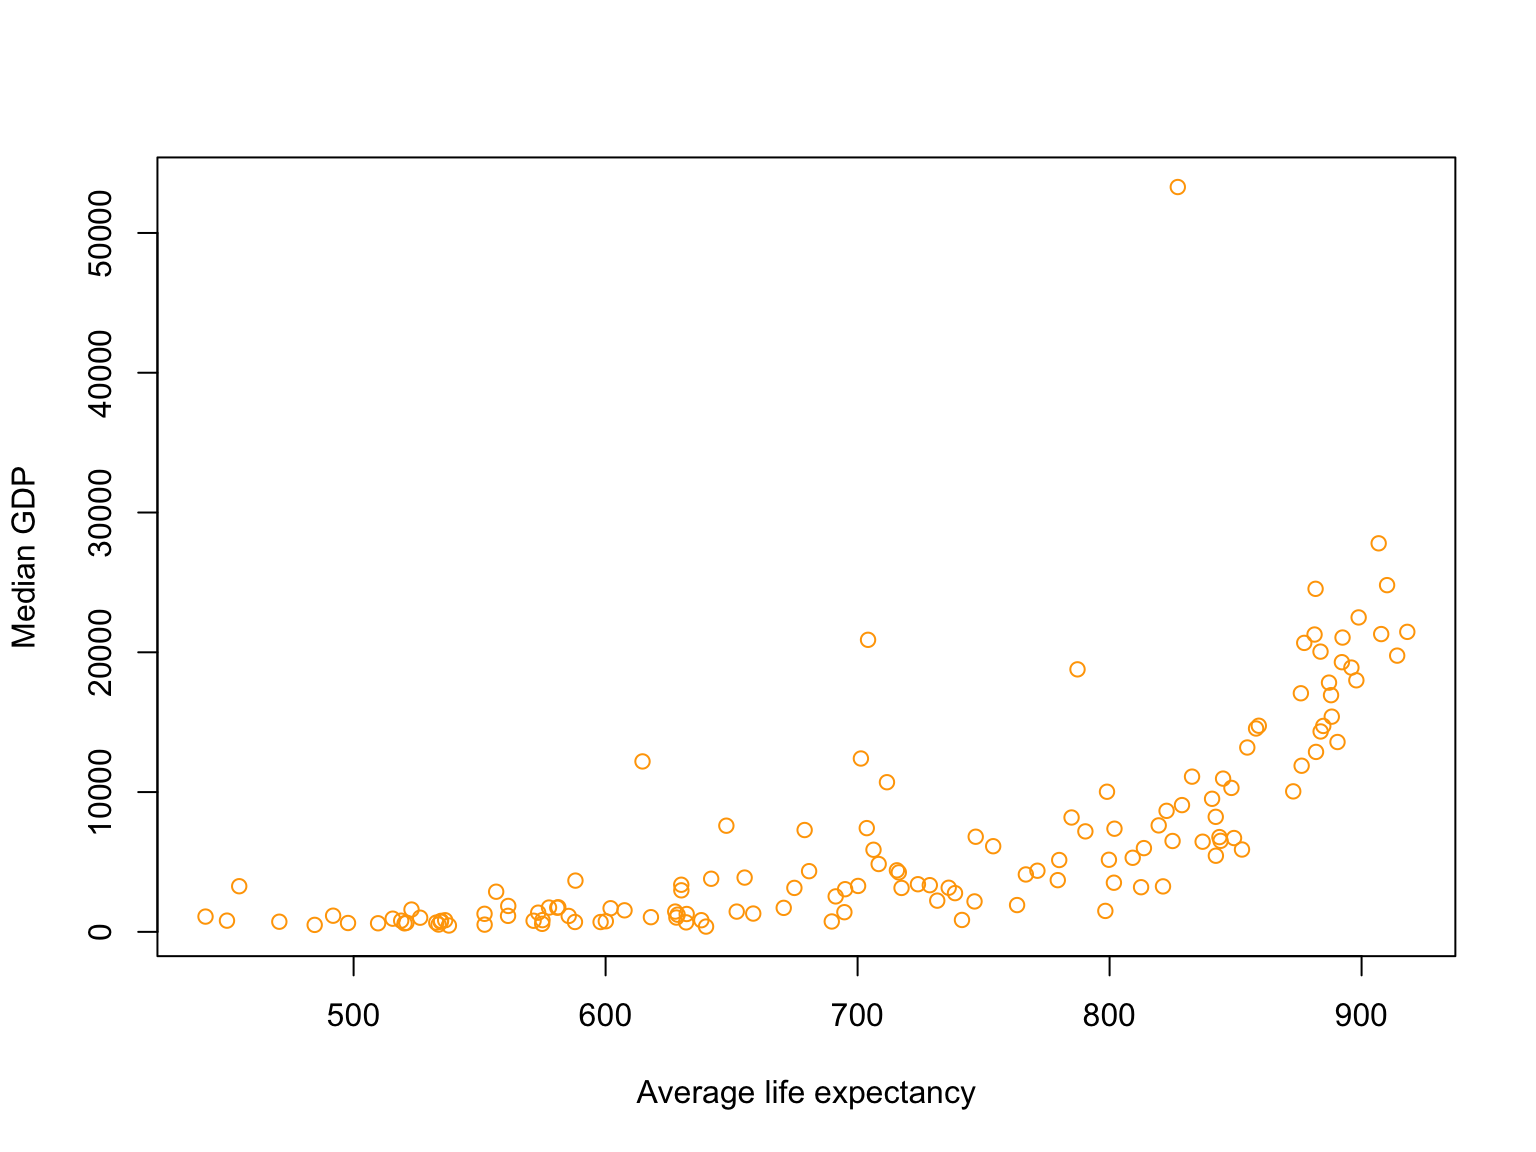
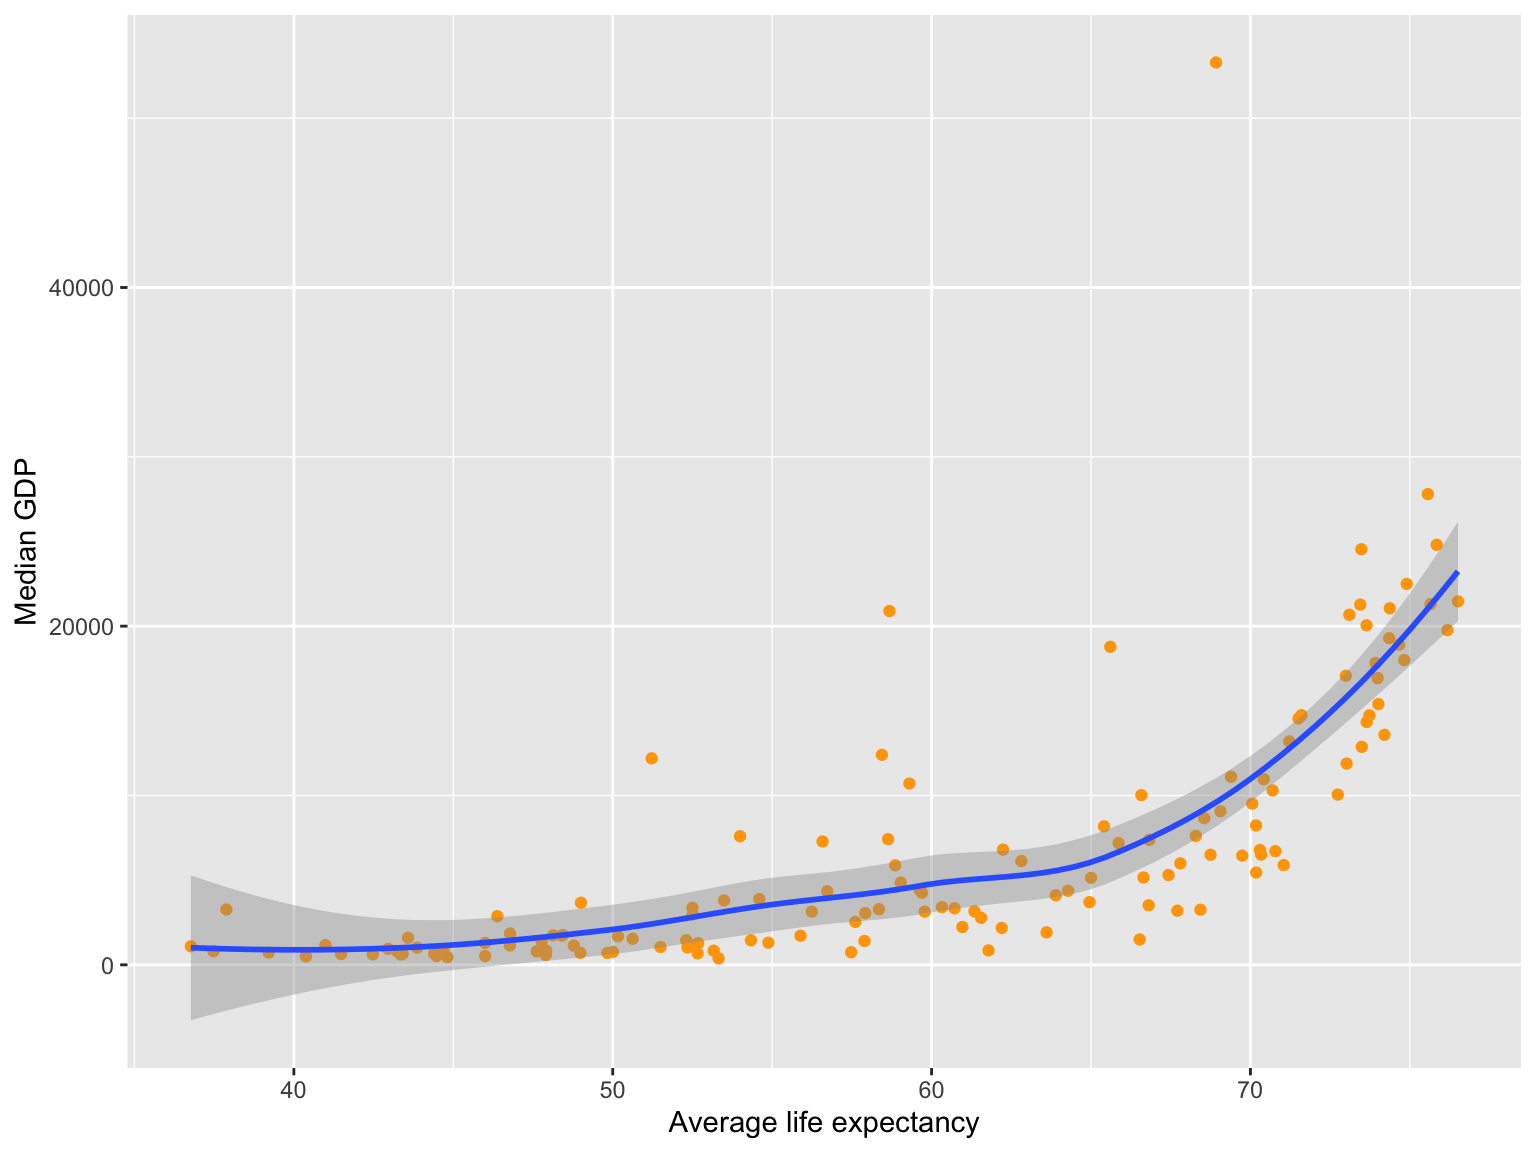
Solutions
- For every year in the dataset calculate the average life expectancy across all countries. Plot the result over time
Iteration
for (i in something)… do something: you know how many iterations you needwhilesome condition is F/T … do something: you don’t know how many iteration it will take
Iteration with purrr
- Functional programming
- Functions of functions: functions can be arguments to other functions, returned to other functions, and be treated as data types.
- Advantages of
purrr:- First argument is data
- All functions are type-stable
- Accepts functions or formulas
- Understand variables by name or position
- Easier to handle errors
Iteration with purrr
All functions are type-stable
map(): listmap_dbl(): doublemap_chr(): charactermap_int(): integermap_raw(): raw vectormap_dfr(): data frame binding rowsmap_dfc(): data frame binding columnsmodify(): same as input
Iteration with purrr
Call:
lm(formula = gdpPercap ~ year, data = gapminder)

Coefficients:
(Intercept)         year
  -249693.7        129.8
gapminder |>
ggplot(aes(year, gdpPercap)) +
geom_smooth(method = "lm") + theme_light(base_size = 10)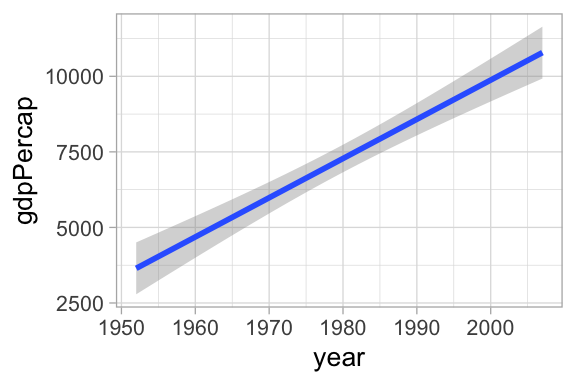
split(gapminder, ~country) |>
    map(~ lm(gdpPercap ~ year, data = .)) |>
    map(summary) |>
    map(coef) |>
    map_dfr(function(x) x["year","Estimate"]) |>
    pivot_longer(cols = everything(), names_to = "country", values_to = "slope") |>
    arrange(slope)
# A tibble: 142 × 2
country slope
<chr> <dbl>
1 Kuwait -1584.
2 Iraq -48.6
3 Nicaragua -29.4
4 Angola -23.3
5 Djibouti -20.1
6 Madagascar -14.1
7 Congo, Dem. Rep. -12.9
8 Central African Republic -9.81
9 Haiti -9.55
10 Somalia -7.91
# … with 132 more rowsSyntactic sugar
[1] 2 5 8Dealing with failure
When a function fails the process typically stops. What if you need completion and keeping track of errors?
Error in log("juan"): non-numeric argument to mathematical functionList of 2
$ result: num 2.3
$ error : NULLList of 2
$ result: NULL
$ error :List of 2
..$ message: chr "non-numeric argument to mathematical function"
..$ call : language .Primitive("log")(x, base)
..- attr(*, "class")= chr [1:3] "simpleError" "error" "condition"When there is an error, the result is null and the error message captured
Dealing with failure
List of 3
 $ :List of 2
  ..$ result: num 0
  ..$ error : NULL
 $ :List of 2
  ..$ result: num 2.3
  ..$ error : NULL
 $ :List of 2
  ..$ result: NULL
  ..$ error :List of 2
  .. ..$ message: chr "non-numeric argument to mathematical function"
  .. ..$ call   : language .Primitive("log")(x, base)
.. ..- attr(*, "class")= chr [1:3] "simpleError" "error" "condition"List of 2
$ result:List of 3
..$ : num 0
..$ : num 2.3
..$ : NULL
$ error :List of 3
..$ : NULL
..$ : NULL
..$ :List of 2
.. ..$ message: chr "non-numeric argument to mathematical function"
.. ..$ call : language .Primitive("log")(x, base)
.. ..- attr(*, "class")= chr [1:3] "simpleError" "error" "condition"Here you can see the errors by naked eye, but what if you have too many objects?
Dealing with failure
[[1]]
[1] "a"[1] 0.000000 2.302585Advantages:
- You can run your computation in all the objects catching up errors
- You can then investigate what errors you get and why
- Correct and focus only on the problematic cases
purrr offers other adverb functions:
possibly()quietly()
Exercise
- With a data frame of your choice (perhaps your own data!) use functions of the
tidyverseto summarize numeric and non-numeric variables. Extract for example means, max, min, number of observations and missing values. - For categorical variables extract number of levels, observations and missing values.
- Use
map()to automate the process for all variables of the same type- Tip:
keep()anddiscard()
- Tip:
- 15min before the end, share your progress with a colleague
Homework
Prepare for next class an explanation of the following:
- Study the help for the
pmap()andwalk()functions. Bring an example of when they are useful. - Open a GitHub account
- Create a test repository (public)
- Clone it from RStudio in your computer
- If in need of some resources: https://happygitwithr.com
All lecture notes are based on Hadley Wickham’s books R for Data Science and Advanced R.